GameStop 2011 Annual Report Download - page 52
Download and view the complete annual report
Please find page 52 of the 2011 GameStop annual report below. You can navigate through the pages in the report by either clicking on the pages listed below, or by using the keyword search tool below to find specific information within the annual report.-
 1
1 -
2
-
3
-
4
-
5
-
6
-
7
-
8
-
9
-
10
-
11
-
12
-
13
-
14
-
15
-
16
-
17
-
18
-
19
-
20
-
21
-
22
-
23
-
24
-
25
-
26
-
27
-
28
-
29
-
30
-
31
-
32
-
33
-
34
-
35
-
36
-
37
-
38
-
39
-
40
-
41
-
 42
42 -
 43
43 -
 44
44 -
 45
45 -
 46
46 -
 47
47 -
 48
48 -
 49
49 -
 50
50 -
 51
51 -
 52
52 -
 53
53 -
 54
54 -
 55
55 -
 56
56 -
 57
57 -
 58
58 -
 59
59 -
 60
60 -
 61
61 -
 62
62 -
63
-
64
-
65
-
66
-
67
-
68
-
69
-
70
-
71
-
72
-
73
-
74
-
75
-
76
-
77
-
78
-
79
-
80
-
81
-
82
-
83
-
84
-
85
-
86
-
87
-
88
-
89
-
90
-
91
-
92
-
93
-
94
-
95
-
96
-
97
-
98
-
99
-
100
-
101
-
102
-
103
-
104
-
105
-
106
-
107
-
108
-
109
-
110
-
111
-
112
-
113
-
114
-
115
-
116
 |
 |

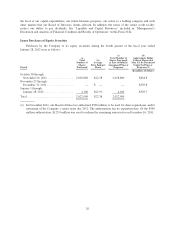
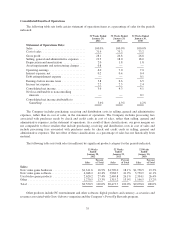
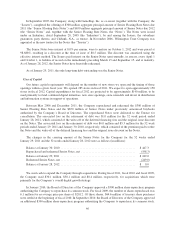
The following table sets forth gross profit (in millions) and gross profit percentages by significant product
category for the periods indicated:
52 Weeks
Ended
January 28,
2012
52 Weeks
Ended
January 29,
2011
52 Weeks
Ended
January 30,
2010
Gross
Profit
Gross
Profit
Percent
Gross
Profit
Gross
Profit
Percent
Gross
Profit
Gross
Profit
Percent
Gross Profit:
New video game hardware .................. $ 113.6 7.0% $ 124.9 7.3% $ 113.5 6.5%
New video game software ................... 839.0 20.7% 819.6 20.7% 795.0 21.3%
Used video game products ................... 1,221.2 46.6% 1,140.5 46.2% 1,121.2 46.8%
Other ................................... 505.7 39.8% 452.6 34.4% 405.0 33.8%
Total .................................... $2,679.5 28.1% $2,537.6 26.8% $2,434.7 26.8%
Fiscal 2011 Compared to Fiscal 2010
Sales increased $76.8 million, or 0.8%, to $9,550.5 million in the 52 weeks of fiscal 2011 compared to
$9,473.7 million in the 52 weeks of fiscal 2010. The increase in sales was primarily attributable to changes in
foreign exchange rates, which had the effect of increasing sales by $140.2 million when compared to the 52
weeks of fiscal 2010 and the increase of non-comparable store sales from the increase in net store count of 233
stores since January 30, 2010, offset partially by a decrease in comparable store sales of 2.1%. The decrease in
comparable store sales was primarily due to a decrease in comparable new video game hardware sales as the
current generation of hardware platforms continues to age. Stores are included in our comparable store sales base
beginning in the thirteenth month of operation and exclude the effect of changes in foreign exchange rates.
New video game hardware sales decreased $108.4 million, or 6.3%, from fiscal 2010 to fiscal 2011,
primarily due to a decrease in hardware unit sell-through, primarily in the Nintendo Wii and handheld categories,
partially offset by the launch of the Nintendo 3DS. New video game software sales increased $79.5 million, or
2.0%, from fiscal 2010 to fiscal 2011, primarily due to changes in foreign exchange rates. Used video game
product sales increased $150.4 million, or 6.1%, from fiscal 2010 to fiscal 2011, primarily due to increased
promotional efforts using our PowerUp Rewards program and changes in merchandising. Sales of other product
categories decreased $44.7 million, or 3.4%, from fiscal 2010 to fiscal 2011. The decrease in other product sales
was primarily due to the decrease in sales of new release PC entertainment software titles and the shift in digital
sales from inventoriable pre-purchased product, recorded as revenue at the retail price, to non-inventoriable
digitally downloadable content, recorded as revenue on a commission basis, offset partially by changes in foreign
exchange rates.
As a percentage of sales, new video game software sales and used video game product sales increased, while
new video game hardware sales and other product sales decreased, from fiscal 2010 to fiscal 2011. The change in
the mix of sales was primarily due to the increase in used video game product sales as discussed above and the
decrease in new video game hardware sales due to the continued aging of the current generation of hardware
platforms.
Cost of sales decreased by $65.1 million, or 0.9%, from $6,936.1 million in fiscal 2010 to $6,871.0 million
in fiscal 2011 as a result of the changes in gross profit discussed below.
Gross profit increased by $141.9 million, or 5.6%, from $2,537.6 million in fiscal 2010 to $2,679.5 million
in fiscal 2011. Gross profit as a percentage of sales was 26.8% in fiscal 2010 and 28.1% in fiscal 2011. The gross
profit percentage increase was primarily due to the increase in sales of used video game products as a percentage
of total sales and the increase in gross profit as a percentage of sales on other products, including the increase in
36