GameStop 2011 Annual Report Download - page 4
Download and view the complete annual report
Please find page 4 of the 2011 GameStop annual report below. You can navigate through the pages in the report by either clicking on the pages listed below, or by using the keyword search tool below to find specific information within the annual report.-
 1
1 -
 2
2 -
 3
3 -
 4
4 -
 5
5 -
 6
6 -
 7
7 -
 8
8 -
 9
9 -
 10
10 -
 11
11 -
 12
12 -
 13
13 -
 14
14 -
 15
15 -
16
-
17
-
18
-
19
-
20
-
21
-
22
-
23
-
24
-
25
-
26
-
27
-
28
-
29
-
30
-
31
-
32
-
33
-
34
-
35
-
36
-
37
-
38
-
39
-
40
-
41
-
42
-
43
-
44
-
45
-
46
-
47
-
48
-
49
-
50
-
51
-
52
-
53
-
54
-
55
-
56
-
57
-
58
-
59
-
60
-
61
-
62
-
63
-
64
-
65
-
66
-
67
-
68
-
69
-
70
-
71
-
72
-
73
-
74
-
75
-
76
-
77
-
78
-
79
-
80
-
81
-
82
-
83
-
84
-
85
-
86
-
87
-
88
-
89
-
90
-
91
-
92
-
93
-
94
-
95
-
96
-
97
-
98
-
99
-
100
-
101
-
102
-
103
-
104
-
105
-
106
-
107
-
108
-
109
-
110
-
111
-
112
-
113
-
114
-
115
-
116
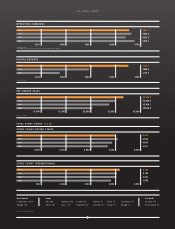
 |
 |

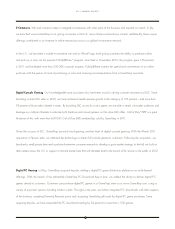
TOTAL REVENUES
EARNINGS PER SHARE
$2,000 $4,000
$1.50$1.00
$6,000
$2.00
$8,000
$2.50
$10,000
$3.00
$9,550
$2.87*
2011
2011
2008
2008
2010
2010
2009
2009
$9,474
$2.65
$9,078
$2.25
$8,806
$2.38
Diluted earnings per share
*Non-GAAP results; excludes restructuring, impairment and debt-retirement expenses
Revenue in millions
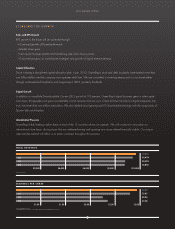
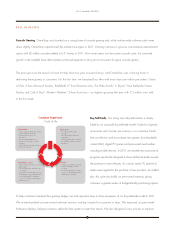
SCORECARD FOR GROWTH
Sales and EPS Growth
EPS growth in the future will be achieved through:
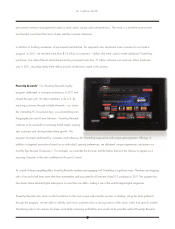
• Continued growth of PowerUp Rewards
• Market share gains
• Net square footage decline and transferring sales from closing stores
• Continued progress on multichannel strategies and growth of digital revenue streams
Capital Allocation
Since initiating a disciplined capital allocation plan in Jan. 2010, GameStop’s stock and debt buybacks have totaled more than
one billion dollars and the company now operates debt free. We are committed to returning excess cash to our shareholders
through continued stock buybacks and, beginning in 2012, quarterly dividends.
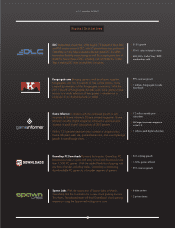
Digital Growth
In addition to incredible Downloadable Content (DLC) growth of 315 percent, GameStop’s digital business grew in other signifi -
cant areas. Kongregate.com grew considerably in both revenue and site visits. Game Informer launched a digital magazine that
now has more than one million subscribers. We also added cloud gaming and PC download technology with the acquisitions of
Spawn Labs and Impulse.
International Presence
GameStop holds leading market share in most of the 15 countries where we operate. We will continue to rationalize our
international store base, closing stores that are underperforming and opening new stores where fi nancially viable. Our unique
sales transfer method will allow us to retain customers throughout this process.
2011 ANNUAL REPORT
2