GameStop 2011 Annual Report Download - page 80
Download and view the complete annual report
Please find page 80 of the 2011 GameStop annual report below. You can navigate through the pages in the report by either clicking on the pages listed below, or by using the keyword search tool below to find specific information within the annual report.-
 1
1 -
2
-
3
-
4
-
5
-
6
-
7
-
8
-
9
-
10
-
11
-
12
-
13
-
14
-
15
-
16
-
17
-
18
-
19
-
20
-
21
-
22
-
23
-
24
-
25
-
26
-
27
-
28
-
29
-
30
-
31
-
32
-
33
-
34
-
35
-
36
-
37
-
38
-
39
-
40
-
41
-
42
-
43
-
44
-
45
-
46
-
47
-
48
-
49
-
50
-
51
-
52
-
53
-
54
-
55
-
56
-
57
-
58
-
59
-
60
-
61
-
62
-
63
-
64
-
65
-
66
-
67
-
68
-
69
-
 70
70 -
 71
71 -
 72
72 -
 73
73 -
 74
74 -
 75
75 -
 76
76 -
 77
77 -
 78
78 -
 79
79 -
 80
80 -
 81
81 -
 82
82 -
 83
83 -
 84
84 -
 85
85 -
 86
86 -
 87
87 -
 88
88 -
 89
89 -
 90
90 -
91
-
92
-
93
-
94
-
95
-
96
-
97
-
98
-
99
-
100
-
101
-
102
-
103
-
104
-
105
-
106
-
107
-
108
-
109
-
110
-
111
-
112
-
113
-
114
-
115
-
116
 |
 |

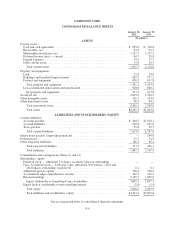
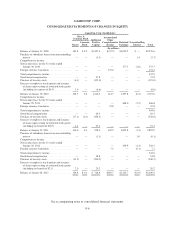
GAMESTOP CORP.
CONSOLIDATED STATEMENTS OF CHANGES IN EQUITY
GameStop Corp. Stockholders
Noncontrolling
Interest Total
Class A
Common Stock Additional
Paid-in
Capital
Accumulated
Other
Comprehensive
Income
Retained
EarningsShares
Common
Stock
(In millions)
Balance at January 31, 2009 ................. 163.8 $ 0.2 $1,307.4 $ (57.5) $1,020.5 $ — $2,270.6
Purchase of subsidiary shares from noncontrolling
interest ................................ — — (5.1) — — 1.4 (3.7)
Comprehensive income:
Net income (loss) for the 52 weeks ended
January 30, 2010 ........................ — — — — 377.3 (1.6) 375.7
Foreign currency translation ................. — — — 172.2 — — 172.2
Total comprehensive income ................. 547.9
Stock-based compensation .................. — — 37.8 — — — 37.8
Purchase of treasury stock ................... (6.1) — (123.0) — — — (123.0)
Exercise of employee stock options and issuance
of shares upon vesting of restricted stock grants
(including tax expense of $0.3) ............. 1.0 — (6.6) — — — (6.6)
Balance at January 30, 2010 ................. 158.7 0.2 1,210.5 114.7 1,397.8 (0.2) 2,723.0
Comprehensive income:
Net income (loss) for the 52 weeks ended
January 29, 2011 ........................ — — — — 408.0 (1.2) 406.8
Foreign currency translation ................. — — — 47.8 — — 47.8
Total comprehensive income ................. 454.6
Stock-based compensation .................. — — 29.5 — — — 29.5
Purchase of treasury stock ................... (17.1) (0.1) (338.5) — — — (338.6)
Exercise of employee stock options and issuance
of shares upon vesting of restricted stock grants
(including tax benefit of $18.7) ............. 4.4 — 27.4 — — — 27.4
Balance at January 29, 2011 ................. 146.0 0.1 928.9 162.5 1,805.8 (1.4) 2,895.9
Purchase of subsidiary shares from noncontrolling
interest ................................ — — (1.1) — — 1.0 (0.1)
Comprehensive income:
Net income (loss) for the 52 weeks ended
January 28, 2012 ........................ — — — — 339.9 (1.4) 338.5
Foreign currency translation ................. — — — 7.2 — (0.1) 7.1
Total comprehensive income ................. 345.6
Stock-based compensation .................. — — 18.8 — — — 18.8
Purchase of treasury stock ................... (11.2) — (240.2) — — — (240.2)
Exercise of employee stock options and issuance
of shares upon vesting of restricted stock grants
(including tax benefit of $2.1) .............. 2.0 — 20.2 — — — 20.2
Balance at January 28, 2012 ................. 136.8 $ 0.1 $ 726.6 $169.7 $2,145.7 $(1.9) $3,040.2
See accompanying notes to consolidated financial statements.
F-6