GameStop 2011 Annual Report Download - page 58
Download and view the complete annual report
Please find page 58 of the 2011 GameStop annual report below. You can navigate through the pages in the report by either clicking on the pages listed below, or by using the keyword search tool below to find specific information within the annual report.-
 1
1 -
2
-
3
-
4
-
5
-
6
-
7
-
8
-
9
-
10
-
11
-
12
-
13
-
14
-
15
-
16
-
17
-
18
-
19
-
20
-
21
-
22
-
23
-
24
-
25
-
26
-
27
-
28
-
29
-
30
-
31
-
32
-
33
-
34
-
35
-
36
-
37
-
38
-
39
-
40
-
41
-
42
-
43
-
44
-
45
-
46
-
47
-
 48
48 -
 49
49 -
 50
50 -
 51
51 -
 52
52 -
 53
53 -
 54
54 -
 55
55 -
 56
56 -
 57
57 -
 58
58 -
 59
59 -
 60
60 -
 61
61 -
 62
62 -
 63
63 -
 64
64 -
 65
65 -
 66
66 -
 67
67 -
 68
68 -
69
-
70
-
71
-
72
-
73
-
74
-
75
-
76
-
77
-
78
-
79
-
80
-
81
-
82
-
83
-
84
-
85
-
86
-
87
-
88
-
89
-
90
-
91
-
92
-
93
-
94
-
95
-
96
-
97
-
98
-
99
-
100
-
101
-
102
-
103
-
104
-
105
-
106
-
107
-
108
-
109
-
110
-
111
-
112
-
113
-
114
-
115
-
116
 |
 |

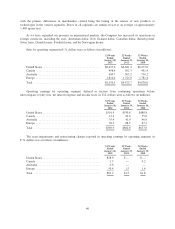
Excluding the impact of changes in exchange rates, sales in the Australian segment decreased 2.7%. The decrease
in sales was primarily due to the decrease in sales at existing stores offset by the additional sales at the 15 stores
opened since January 30, 2011. The decrease in sales at existing stores when compared to fiscal 2010 was
primarily due to a decrease in comparable new video game hardware sales as the current generation of hardware
platforms continues to age.
Segment operating income in fiscal 2011 decreased by $5.6 million to $35.4 million when compared to
$41.0 million in fiscal 2010. The decrease in operating earnings for fiscal 2011 was due to the decrease in sales at
existing stores and the increase in selling, general and administrative expenses associated with the increase in the
number of stores in operation. This decrease in operating earnings was partially offset by the favorable impact of
changes in exchange rates which had the effect of increasing operating earnings by $1.7 million when compared
to fiscal 2010.
Europe
Segment results for Europe include retail operations in 13 European countries and e-commerce operations in
six countries. As of January 28, 2012, the European segment operated 1,423 stores, compared to 1,384 stores as
of January 29, 2011. For the 52 weeks ended January 28, 2012, European sales increased 5.0% compared to the
52 weeks ended January 29, 2011. This increase in sales was primarily due to the favorable impact of changes in
exchange rates in fiscal 2011, which had the effect of increasing sales by $73.8 million when compared to fiscal
2010. Excluding the impact of changes in exchange rates, sales in the European segment increased 0.7%. The
increase in sales was primarily due to additional sales in the 89 new stores opened since January 30, 2011,
partially offset by a decrease in sales at existing stores. The decrease in sales at existing stores was primarily
driven by weak consumer traffic due to the continued macroeconomic uncertainty and a decrease in comparable
new video game hardware sales as the current generation of hardware platforms continues to age.
The segment operating income in Europe for fiscal 2011 decreased by $48.0 million to $20.2 million
compared to $68.2 million in fiscal 2010. The decrease in the operating income was primarily due to the impact
of asset impairments and restructuring charges of $50.4 million, consisting primarily of the impairment of the
Micromania trade name in the amount of $37.8 million. The remaining amount of $12.6 million consists of
property and equipment impairments, other asset impairments, termination benefits, and facility closure and other
costs.
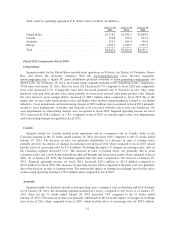
Fiscal 2010 Compared to Fiscal 2009
United States
Segment results for the United States include retail operations in 50 states, the District of Columbia, Puerto
Rico and Guam, the electronic commerce Web site www.gamestop.com, Game Informer magazine and
www.kongregate.com, an online video gaming site. As of January 29, 2011, the United States segment included
4,536 GameStop stores, compared to 4,429 stores on January 30, 2010. Sales for fiscal 2010 increased 6.5%
compared to fiscal 2009 as a result of increased sales at existing stores and the additional sales at the 434 stores
opened since January 31, 2009, including the 227 stores opened in fiscal 2010. Sales at existing stores increased
primarily due to strong sales of new release video game software and PC entertainment software and increased
market share, partially offset by a slow-down in hardware unit sales. Segment operating income for fiscal 2010
increased by 8.6% compared to fiscal 2009, driven by the increase in sales and related margin discussed above.
Canada
Segment results for Canada include retail operations and an e-commerce site in Canada. Sales in the
Canadian segment in the 52 weeks ended January 29, 2011 increased 2.2% compared to the 52 weeks ended
January 30, 2010. The increase in sales was primarily attributable to the favorable impact of changes in exchange
rates in fiscal 2010 when compared to fiscal 2009, which had the effect of increasing sales by $38.8 million.
42