GameStop 2011 Annual Report Download - page 60
Download and view the complete annual report
Please find page 60 of the 2011 GameStop annual report below. You can navigate through the pages in the report by either clicking on the pages listed below, or by using the keyword search tool below to find specific information within the annual report.-
 1
1 -
2
-
3
-
4
-
5
-
6
-
7
-
8
-
9
-
10
-
11
-
12
-
13
-
14
-
15
-
16
-
17
-
18
-
19
-
20
-
21
-
22
-
23
-
24
-
25
-
26
-
27
-
28
-
29
-
30
-
31
-
32
-
33
-
34
-
35
-
36
-
37
-
38
-
39
-
40
-
41
-
42
-
43
-
44
-
45
-
46
-
47
-
48
-
49
-
 50
50 -
 51
51 -
 52
52 -
 53
53 -
 54
54 -
 55
55 -
 56
56 -
 57
57 -
 58
58 -
 59
59 -
 60
60 -
 61
61 -
 62
62 -
 63
63 -
 64
64 -
 65
65 -
 66
66 -
 67
67 -
 68
68 -
 69
69 -
 70
70 -
71
-
72
-
73
-
74
-
75
-
76
-
77
-
78
-
79
-
80
-
81
-
82
-
83
-
84
-
85
-
86
-
87
-
88
-
89
-
90
-
91
-
92
-
93
-
94
-
95
-
96
-
97
-
98
-
99
-
100
-
101
-
102
-
103
-
104
-
105
-
106
-
107
-
108
-
109
-
110
-
111
-
112
-
113
-
114
-
115
-
116
 |
 |
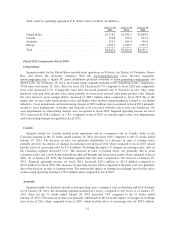
Liquidity and Capital Resources
Cash Flows
During fiscal 2011, cash provided by operations was $624.7 million, compared to cash provided by
operations of $591.2 million in fiscal 2010. The increase in cash provided by operations of $33.5 million from
fiscal 2010 to fiscal 2011 was primarily due to a decrease in cash used for working capital purposes of $49.6
million, primarily driven by lower inventory purchases in fiscal 2011 and the related effects on payments of
accounts payable. The lower inventory purchases were due to lower hardware sales in fiscal 2011, and inventory
management initiatives. Inventory turnover was relatively consistent from fiscal 2010 to fiscal 2011. Also
contributing to the change in cash flows from operating activities for fiscal 2011 compared to fiscal 2010 was the
increase in accrued liabilities, including customer liabilities, primarily related to the growth of the Company’s
PowerUp Rewards program.
During fiscal 2010, cash provided by operations was $591.2 million, compared to cash provided by
operations of $644.2 million in fiscal 2009. The decrease in cash provided by operations of $53.0 million from
fiscal 2009 to fiscal 2010 was primarily due to an increase in cash used for inventory, partially offset by the
increase in accounts payable and accrued liabilities, the increase in prepaid expenses and other current assets and
the decrease in other long-term liabilities, as well as the changes in the adjustment related to the excess tax
benefits realized from the exercise of stock-based awards, which decreased cash provided by operations by
$18.6 million. These decreases were partially offset by an increase in cash provided by consolidated net income,
including the non-cash adjustments to earnings. The increase in net inventory was primarily due to higher
purchases during fiscal 2010, particularly during the holiday season primarily related to hardware units which
were at lower in-stock positions at the end of fiscal 2009.
Cash used in investing activities was $201.6 million in fiscal 2011, $240.1 million in fiscal 2010 and
$187.2 million in fiscal 2009. During fiscal 2011, the Company used $165.1 million for capital expenditures
primarily to invest in information systems, distribution center capacity and e-commerce, digital and loyalty
program initiatives and to open 285 stores in the U.S. and internationally. In addition, during fiscal 2011, the
Company used $30.1 million for acquisitions in support of the Company’s digital initiatives. During fiscal 2010,
the Company used $197.6 million for capital expenditures primarily to open 359 stores and to invest in
information systems and $38.1 million for acquisitions in support of the Company’s digital initiatives. During
fiscal 2009, the Company used $163.8 million for capital expenditures primarily to open 388 new stores and to
invest in information systems. In addition, the Company used $8.4 million on acquisitions.
Cash used in financing activities was $492.6 million in fiscal 2011. Cash used in financing activities was
$555.6 million and $154.4 million in fiscal 2010 and fiscal 2009, respectively. The cash flows used in financing
activities in fiscal 2011 were primarily for the repurchase of $262.1 million of treasury shares and $250.0 million
in principal of the Company’s senior notes. The cash flows used in financing activities in fiscal 2010 were
primarily for the repurchase of $381.2 million of treasury shares and $200.0 million in principal of the
Company’s senior notes. The cash flows used in financing activities in fiscal 2009 were primarily for the
repurchase of $100.0 million in principal of the Company’s senior notes and the repurchase of $58.4 million of
treasury shares. The cash used in financing activities in fiscal 2011, fiscal 2010 and fiscal 2009 was also
impacted by cash provided by the issuance of shares associated with stock option exercises of $18.1 million,
$10.8 million and $4.5 million, respectively.
Sources of Liquidity
We utilize cash generated from operations and have funds available to us under our revolving credit facility
to cover seasonal fluctuations in cash flows and to support our various growth initiatives. Our cash and cash
equivalents are carried at cost, which approximates market value, and consist primarily of time deposits with
highly rated commercial banks and money market investment funds holding direct U.S. Treasury obligations.
44