GameStop 2011 Annual Report Download - page 5
Download and view the complete annual report
Please find page 5 of the 2011 GameStop annual report below. You can navigate through the pages in the report by either clicking on the pages listed below, or by using the keyword search tool below to find specific information within the annual report.-
 1
1 -
 2
2 -
 3
3 -
 4
4 -
 5
5 -
 6
6 -
 7
7 -
 8
8 -
 9
9 -
 10
10 -
 11
11 -
 12
12 -
 13
13 -
 14
14 -
 15
15 -
 16
16 -
17
-
18
-
19
-
20
-
21
-
22
-
23
-
24
-
25
-
26
-
27
-
28
-
29
-
30
-
31
-
32
-
33
-
34
-
35
-
36
-
37
-
38
-
39
-
40
-
41
-
42
-
43
-
44
-
45
-
46
-
47
-
48
-
49
-
50
-
51
-
52
-
53
-
54
-
55
-
56
-
57
-
58
-
59
-
60
-
61
-
62
-
63
-
64
-
65
-
66
-
67
-
68
-
69
-
70
-
71
-
72
-
73
-
74
-
75
-
76
-
77
-
78
-
79
-
80
-
81
-
82
-
83
-
84
-
85
-
86
-
87
-
88
-
89
-
90
-
91
-
92
-
93
-
94
-
95
-
96
-
97
-
98
-
99
-
100
-
101
-
102
-
103
-
104
-
105
-
106
-
107
-
108
-
109
-
110
-
111
-
112
-
113
-
114
-
115
-
116
 |
 |
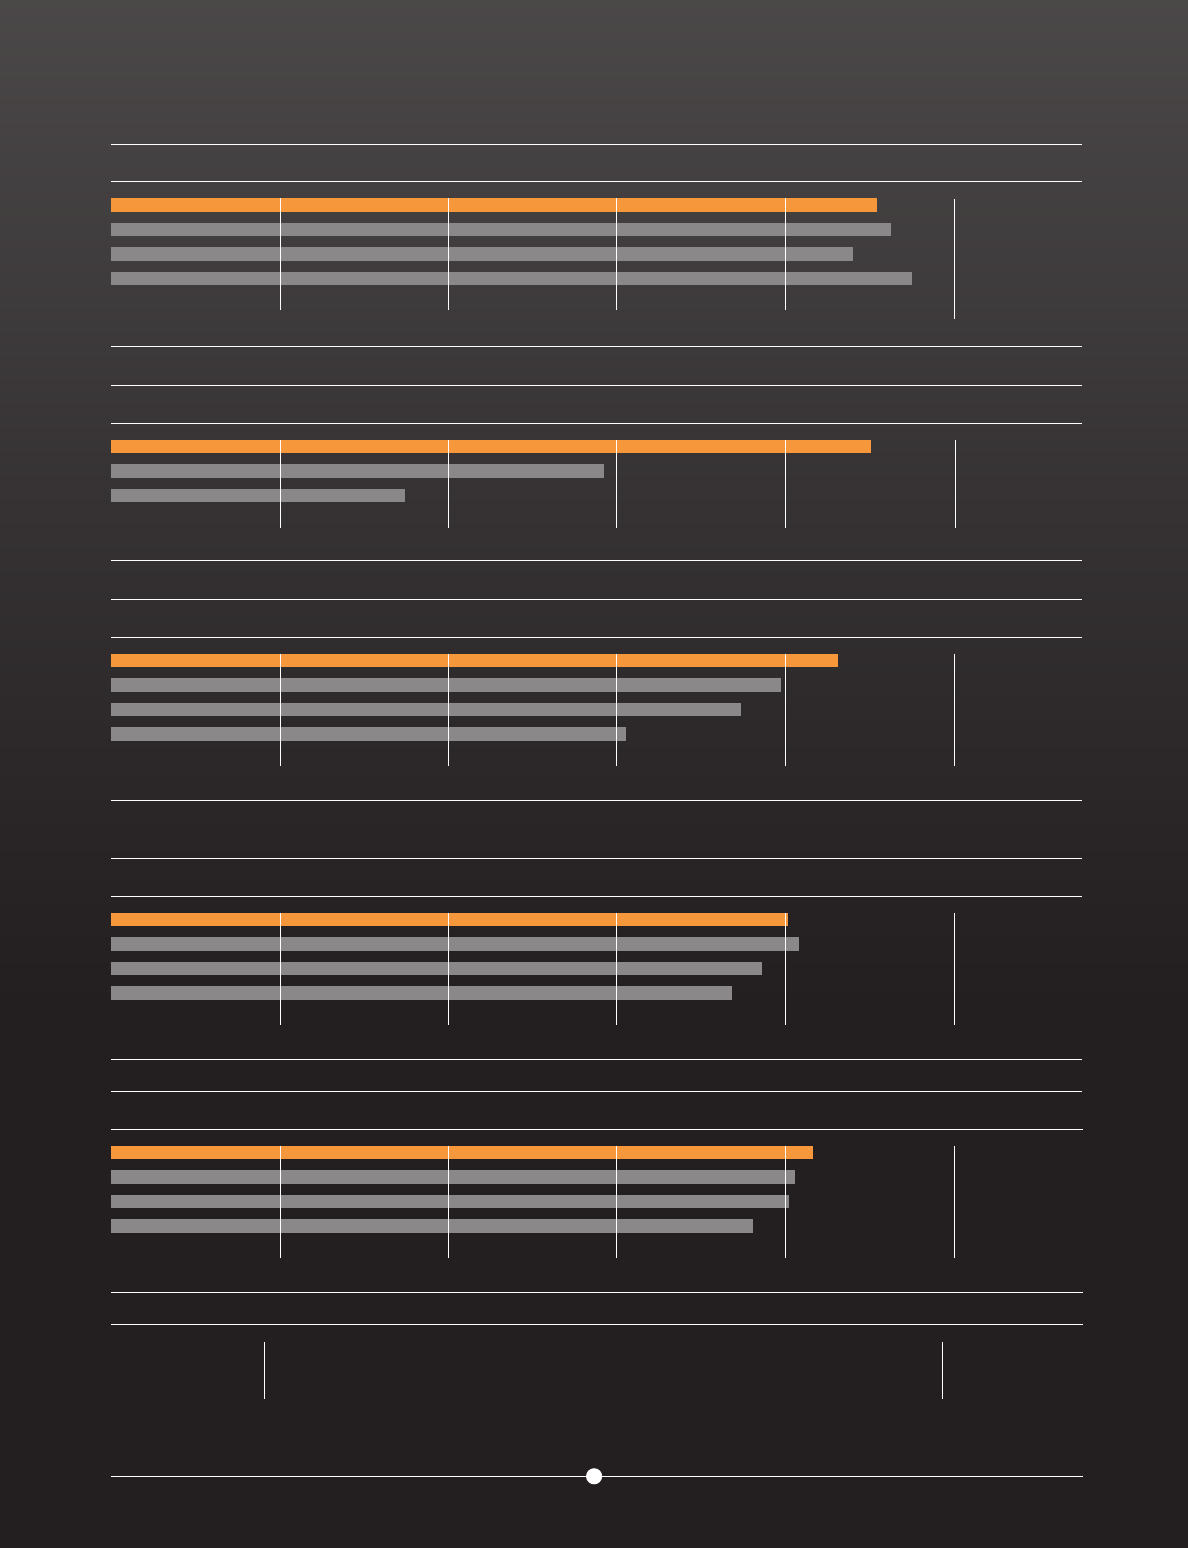
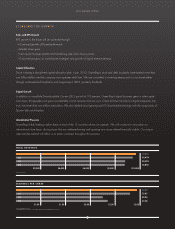
DIGITAL RECEIPTS
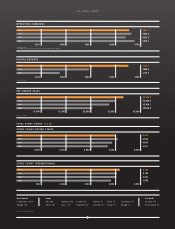
STORE COUNT UNITED STATES
TOTAL STORE COUNT: 6,683
STORE COUNT INTERNATIONAL
North America
United States: 4,503
Canada: 346
Asia Pacifi c
Australia: 372
New Zealand: 39
Europe
Italy: 420
France: 391
Germany: 208
Spain: 116
Sweden: 65
Ireland/UK: 52
Norway: 51
Denmark: 42
Austria: 27
Finland: 19
Switzerland: 19
Portugal: 13
OPERATING EARNINGS
PRE-OWNED SALES
$200
3,500
1,000
$400
$1,500
$100
3,000
500
$300
$1,000
$300
4,000
1,500
$500
$2,000
$400
4,500
2,000
$600
$2,500
$500
5,000
2,500
$700
$3,000
$453.4
4,503
2,180
$651.1*
$2,620.2
2011
2011
2011
2011
2011
2008
2008
2008
2008
2010
2010
2010
2010
2010
2009
2009
2009
2009
2009
$288.6
4,536
2,134
$662.6
$2,469.8
$179.7
4,429
2,021
$637.0
$2,394.1
4,331
1,876
$675.1
$2,026.6
Receipts in millions
Earnings in millions
*Non-GAAP results; excludes restructuring, impairment and debt-retirement expenses
Store count as of Jan. 28, 2012
Revenue in millions
2011 ANNUAL REPORT
3