GameStop 2011 Annual Report Download - page 53
Download and view the complete annual report
Please find page 53 of the 2011 GameStop annual report below. You can navigate through the pages in the report by either clicking on the pages listed below, or by using the keyword search tool below to find specific information within the annual report.-
 1
1 -
2
-
3
-
4
-
5
-
6
-
7
-
8
-
9
-
10
-
11
-
12
-
13
-
14
-
15
-
16
-
17
-
18
-
19
-
20
-
21
-
22
-
23
-
24
-
25
-
26
-
27
-
28
-
29
-
30
-
31
-
32
-
33
-
34
-
35
-
36
-
37
-
38
-
39
-
40
-
41
-
42
-
 43
43 -
 44
44 -
 45
45 -
 46
46 -
 47
47 -
 48
48 -
 49
49 -
 50
50 -
 51
51 -
 52
52 -
 53
53 -
 54
54 -
 55
55 -
 56
56 -
 57
57 -
 58
58 -
 59
59 -
 60
60 -
 61
61 -
 62
62 -
 63
63 -
64
-
65
-
66
-
67
-
68
-
69
-
70
-
71
-
72
-
73
-
74
-
75
-
76
-
77
-
78
-
79
-
80
-
81
-
82
-
83
-
84
-
85
-
86
-
87
-
88
-
89
-
90
-
91
-
92
-
93
-
94
-
95
-
96
-
97
-
98
-
99
-
100
-
101
-
102
-
103
-
104
-
105
-
106
-
107
-
108
-
109
-
110
-
111
-
112
-
113
-
114
-
115
-
116
 |
 |
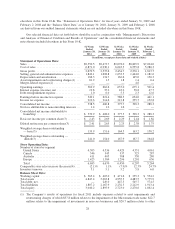
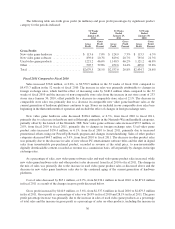
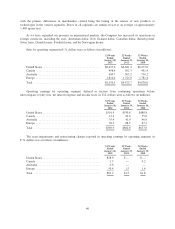
sales of digital products, from fiscal 2010 to fiscal 2011. Gross profit as a percentage of sales on new video game
hardware decreased slightly from 7.3% in fiscal 2010 to 7.0% in fiscal 2011. Gross profit as a percentage of sales
on new video game software stayed constant at 20.7% for fiscal 2010 and fiscal 2011. Gross profit as a
percentage of sales on used video game products increased from 46.2% in fiscal 2010 to 46.6% in fiscal 2011 due
to decreased promotional activities in the holiday selling season. Gross profit as a percentage of sales on the
other product sales category increased from 34.4% in fiscal 2010 to 39.8% in fiscal 2011 primarily due to a shift
in sales to higher margin digital products, some of which are recorded on a commission basis at 100% margin,
and growth in sales of PowerUp Rewards Pro memberships and related Game Informer subscriptions that also
have higher margins than PC entertainment software and accessories.
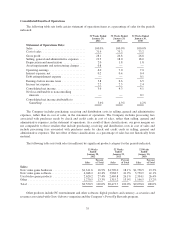
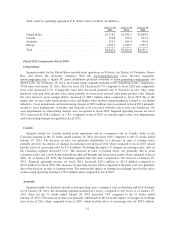
Selling, general and administrative expenses increased by $143.3 million, or 8.4%, from $1,698.8 million in
fiscal 2010 to $1,842.1 million in fiscal 2011. This increase was attributable to changes in foreign exchange rates
which had the effect of increasing expenses by $29.0 million when compared to fiscal 2010, as well as additional
expenses incurred in support of our digital and loyalty initiatives. Selling, general and administrative expenses as
a percentage of sales increased from 18.0% in the fiscal 2010 to 19.3% in fiscal 2011. The increase in selling,
general and administrative expenses as a percentage of sales was primarily due to deleveraging of fixed costs as a
result of the decrease in comparable store sales and the additional expenses incurred in support of our digital and
loyalty initiatives in fiscal 2011. Included in selling, general and administrative expenses are $18.8 million and
$29.6 million in stock-based compensation expense for fiscal 2011 and fiscal 2010, respectively.
Depreciation and amortization expense increased $11.6 million from $174.7 million in fiscal 2010 to
$186.3 million in fiscal 2011. This increase was primarily due to the capital expenditures associated with the
opening of 285 new stores during fiscal 2011 and investments in management information systems, including
investments in digital and loyalty initiatives.
During fiscal 2011, the Company recorded asset impairments and restructuring charges of $81.2 million.
These charges were primarily due to impairment of the Company’s Micromania trade name in France and
impairment and disposal costs related to the exit of non-core businesses, primarily a small retail movie chain of
stores owned by the Company until fiscal 2011. Restructuring costs include disposal and exit costs related to the
exit of underperforming regions in Europe and consolidation of home office and back office functions, as well as
impairment and store closure costs primarily in the international segments.
Interest income resulting from the investment of excess cash balances decreased from $1.8 million in fiscal
2010 to $0.9 million in fiscal 2011 due primarily to lower invested cash balances and lower interest rates during
fiscal 2011. Interest expense decreased from $37.0 million in fiscal 2010 to $20.7 million in fiscal 2011,
primarily due to the redemption of $250.0 and $200.0 million of the Company’s senior notes during fiscal 2011
and fiscal 2010, respectively. Debt extinguishment expense of $1.0 million was recognized in fiscal 2011 as a
result of the recognition of deferred financing fees and unamortized original issue discount. Debt extinguishment
expense of $6.0 million was recognized in fiscal 2010 as a result of premiums paid related to debt retirement and
the recognition of deferred financing fees and unamortized original issue discount.
Income tax expense decreased by $4.0 million, from $214.6 million in fiscal 2010 to $210.6 million in fiscal
2011. The Company’s effective tax rate increased from 34.5% in fiscal 2010 to 38.4% in fiscal 2011 due
primarily to the variability in the accounting for the Company’s uncertain tax positions and the effect of asset
impairments and restructuring charges on the tax rate in fiscal 2011 due to certain charges which have no tax
benefits. See Note 13 of “Notes to Consolidated Financial Statements” for additional information regarding
income taxes.
The factors described above led to a decrease in operating earnings of $92.7 million, or 14.0%, from
$662.6 million in fiscal 2010 to $569.9 million in fiscal 2011 and a decrease in consolidated net income of
$68.3 million, or 16.8%, from $406.8 million in fiscal 2010 to $338.5 million in fiscal 2011.
37