GameStop 2011 Annual Report Download - page 40
Download and view the complete annual report
Please find page 40 of the 2011 GameStop annual report below. You can navigate through the pages in the report by either clicking on the pages listed below, or by using the keyword search tool below to find specific information within the annual report.-
 1
1 -
2
-
3
-
4
-
5
-
6
-
7
-
8
-
9
-
10
-
11
-
12
-
13
-
14
-
15
-
16
-
17
-
18
-
19
-
20
-
21
-
22
-
23
-
24
-
25
-
26
-
27
-
28
-
29
-
 30
30 -
 31
31 -
 32
32 -
 33
33 -
 34
34 -
 35
35 -
 36
36 -
 37
37 -
 38
38 -
 39
39 -
 40
40 -
 41
41 -
 42
42 -
 43
43 -
 44
44 -
 45
45 -
 46
46 -
 47
47 -
 48
48 -
 49
49 -
 50
50 -
51
-
52
-
53
-
54
-
55
-
56
-
57
-
58
-
59
-
60
-
61
-
62
-
63
-
64
-
65
-
66
-
67
-
68
-
69
-
70
-
71
-
72
-
73
-
74
-
75
-
76
-
77
-
78
-
79
-
80
-
81
-
82
-
83
-
84
-
85
-
86
-
87
-
88
-
89
-
90
-
91
-
92
-
93
-
94
-
95
-
96
-
97
-
98
-
99
-
100
-
101
-
102
-
103
-
104
-
105
-
106
-
107
-
108
-
109
-
110
-
111
-
112
-
113
-
114
-
115
-
116
 |
 |

either renewals at present locations, leases for equivalent locations in the same area, or be able to close the stores
with expiring leases and transfer enough of the sales to other nearby stores to improve, if not at least maintain,
profitability.
The terms of the store leases for the 6,683 leased stores open as of January 28, 2012 expire as follows:
Lease Terms to Expire During
Number
of Stores
(12 Months Ending on or About January 31)
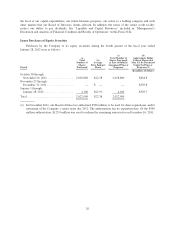
Expired and in negotiations .................................................... 17
2012 ...................................................................... 1,634
2013 ...................................................................... 2,268
2014 ...................................................................... 1,047
2015 ...................................................................... 551
2016 and later .............................................................. 1,166
6,683
At January 28, 2012, the Company owned or leased office and distribution facilities, with lease expiration
dates ranging from 2012 to 2021 and an average remaining lease life of approximately four years, in the
following locations:
Location
Square
Footage
Owned or
Leased Use
United States
Grapevine, Texas, USA .............. 519,000 Owned Distribution and administration
Grapevine, Texas, USA .............. 182,000 Owned Manufacturing and distribution
Louisville, Kentucky, USA ............ 260,000 Leased Distribution
Irving, Texas, USA .................. 19,000 Leased Administration
Minneapolis, Minnesota, USA ......... 15,000 Leased Administration
Austin, Texas, USA ................. 9,000 Leased Administration
West Chester, Pennsylvania, USA ...... 6,100 Leased Administration
San Francisco, California, USA ........ 5,300 Leased Administration
Canada
Brampton, Ontario, Canada ........... 119,000 Owned Distribution and administration
Brampton, Ontario, Canada ........... 59,000 Leased Distribution and administration
Australia
Eagle Farm, Queensland, Australia ..... 185,000 Owned Distribution and administration
Auckland, New Zealand .............. 13,000 Leased Distribution and administration
Europe
Arlov, Sweden ..................... 80,000 Owned Distribution and administration
Milan, Italy ........................ 120,000 Owned Distribution and administration
Memmingen, Germany ............... 67,000 Owned Distribution and administration
Valencia, Spain ..................... 22,000 Leased Distribution
Valencia, Spain ..................... 15,000 Leased Administration
Dublin, Ireland ..................... 38,000 Leased Distribution and administration
Paris, France ....................... 78,000 Leased Distribution
Sophia Antipolis, France ............. 17,000 Leased Administration
24