GameStop 2011 Annual Report Download - page 56
Download and view the complete annual report
Please find page 56 of the 2011 GameStop annual report below. You can navigate through the pages in the report by either clicking on the pages listed below, or by using the keyword search tool below to find specific information within the annual report.-
 1
1 -
2
-
3
-
4
-
5
-
6
-
7
-
8
-
9
-
10
-
11
-
12
-
13
-
14
-
15
-
16
-
17
-
18
-
19
-
20
-
21
-
22
-
23
-
24
-
25
-
26
-
27
-
28
-
29
-
30
-
31
-
32
-
33
-
34
-
35
-
36
-
37
-
38
-
39
-
40
-
41
-
42
-
43
-
44
-
45
-
 46
46 -
 47
47 -
 48
48 -
 49
49 -
 50
50 -
 51
51 -
 52
52 -
 53
53 -
 54
54 -
 55
55 -
 56
56 -
 57
57 -
 58
58 -
 59
59 -
 60
60 -
 61
61 -
 62
62 -
 63
63 -
 64
64 -
 65
65 -
 66
66 -
67
-
68
-
69
-
70
-
71
-
72
-
73
-
74
-
75
-
76
-
77
-
78
-
79
-
80
-
81
-
82
-
83
-
84
-
85
-
86
-
87
-
88
-
89
-
90
-
91
-
92
-
93
-
94
-
95
-
96
-
97
-
98
-
99
-
100
-
101
-
102
-
103
-
104
-
105
-
106
-
107
-
108
-
109
-
110
-
111
-
112
-
113
-
114
-
115
-
116
 |
 |

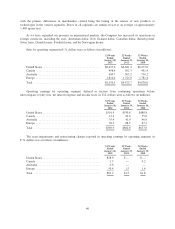
with the primary differences in merchandise carried being the timing of the release of new products or
technologies in the various segments. Stores in all segments are similar in size at an average of approximately
1,400 square feet.
As we have expanded our presence in international markets, the Company has increased its operations in
foreign currencies, including the euro, Australian dollar, New Zealand dollar, Canadian dollar, British pound,
Swiss franc, Danish kroner, Swedish krona, and the Norwegian kroner.
Sales by operating segment in U.S. dollars were as follows (in millions):
52 Weeks
Ended
January 28,
2012
52 Weeks
Ended
January 29,
2011
52 Weeks
Ended
January 30,
2010
United States ....................................... $6,637.0 $6,681.2 $6,275.0
Canada ........................................... 498.4 502.3 491.4
Australia .......................................... 604.7 565.2 530.2
Europe ............................................ 1,810.4 1,725.0 1,781.4
Total ............................................. $9,550.5 $9,473.7 $9,078.0
Operating earnings by operating segment, defined as income from continuing operations before
intercompany royalty fees, net interest expense and income taxes, in U.S. dollars were as follows (in millions):
52 Weeks
Ended
January 28,
2012
52 Weeks
Ended
January 29,
2011
52 Weeks
Ended
January 30,
2010
United States ....................................... $501.9 $530.8 $488.8
Canada ........................................... 12.4 22.6 35.0
Australia .......................................... 35.4 41.0 46.0
Europe ............................................ 20.2 68.2 67.2
Total ............................................. $569.9 $662.6 $637.0
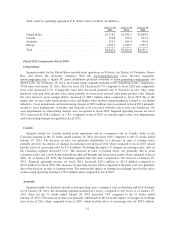
The asset impairments and restructuring charges reported in operating earnings by operating segment, in
U.S. dollars was as follows (in millions):
52 Weeks
Ended
January 28,
2012
52 Weeks
Ended
January 29,
2011
52 Weeks
Ended
January 30,
2010
United States ....................................... $28.9 $ — $ —
Canada ........................................... 1.3 — 0.2
Australia .......................................... 0.6 — —
Europe ............................................ 50.4 1.5 1.6
Total ............................................. $81.2 $1.5 $1.8
40