GameStop 2011 Annual Report Download - page 59
Download and view the complete annual report
Please find page 59 of the 2011 GameStop annual report below. You can navigate through the pages in the report by either clicking on the pages listed below, or by using the keyword search tool below to find specific information within the annual report.-
 1
1 -
2
-
3
-
4
-
5
-
6
-
7
-
8
-
9
-
10
-
11
-
12
-
13
-
14
-
15
-
16
-
17
-
18
-
19
-
20
-
21
-
22
-
23
-
24
-
25
-
26
-
27
-
28
-
29
-
30
-
31
-
32
-
33
-
34
-
35
-
36
-
37
-
38
-
39
-
40
-
41
-
42
-
43
-
44
-
45
-
46
-
47
-
48
-
 49
49 -
 50
50 -
 51
51 -
 52
52 -
 53
53 -
 54
54 -
 55
55 -
 56
56 -
 57
57 -
 58
58 -
 59
59 -
 60
60 -
 61
61 -
 62
62 -
 63
63 -
 64
64 -
 65
65 -
 66
66 -
 67
67 -
 68
68 -
 69
69 -
70
-
71
-
72
-
73
-
74
-
75
-
76
-
77
-
78
-
79
-
80
-
81
-
82
-
83
-
84
-
85
-
86
-
87
-
88
-
89
-
90
-
91
-
92
-
93
-
94
-
95
-
96
-
97
-
98
-
99
-
100
-
101
-
102
-
103
-
104
-
105
-
106
-
107
-
108
-
109
-
110
-
111
-
112
-
113
-
114
-
115
-
116
 |
 |
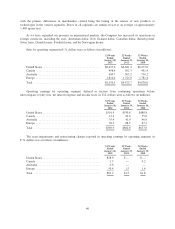
Excluding the impact of changes in exchange rates, sales in the Canadian segment decreased 5.7%. The decrease
in sales was primarily due to the decrease in sales at existing stores, offset by the additional sales at the 26 stores
opened since January 31, 2009. As of January 29, 2011, the Canadian segment had 345 stores compared to 337
stores as of January 30, 2010. The decrease in sales at existing stores was primarily due to weak consumer traffic
and a slow-down in hardware unit sell-through and lower price points when compared to fiscal 2009. Segment
operating income for fiscal 2010 decreased $12.4 million to $22.6 million compared to $35.0 million for fiscal
2009. The decrease in operating income when compared to the prior year was primarily due to the decrease in
sales at existing stores and the increase in selling, general and administrative expenses associated with the
increase in the number of stores in operation. The decrease in operating income was partially offset by the
favorable impact of changes in exchange rates which had the effect of increasing operating earnings by
$1.6 million when compared to fiscal 2009.
Australia
Segment results for Australia include retail operations and e-commerce sites in Australia and New Zealand.
As of January 29, 2011, the Australian segment included 405 stores, compared to 388 stores as of January 30,
2010. Sales for the 52 weeks ended January 29, 2011 increased 6.6% compared to the 52 weeks ended
January 30, 2010. The increase in sales was primarily attributable to the favorable impact of changes in exchange
rates in fiscal 2010 when compared to fiscal 2009, which had the effect of increasing sales by $63.8 million.
Excluding the impact of changes in exchange rates, sales in the Australian segment decreased 5.4%. The decrease
in sales was primarily due to the decrease in sales at existing stores offset by the additional sales at the 59 stores
opened since January 31, 2009. The decrease in sales at existing stores was primarily due to weak consumer
traffic and a slow-down in hardware unit sell-through and lower price points when compared to fiscal 2009.
Segment operating income in fiscal 2010 decreased by $5.0 million to $41.0 million when compared to
$46.0 million in fiscal 2009. The decrease in operating earnings for fiscal 2010 was due to the decrease in sales at
existing stores and the increase in selling, general and administrative expenses associated with the increase in the
number of stores in operation. Selling, general and administrative expenses will rise as a percentage of sales
during periods of store count growth due to the fixed nature of many store expenses compared to the immature
sales at new stores. This decrease in operating earnings was offset by the favorable impact of changes in
exchange rates which had the effect of increasing operating earnings by $3.8 million when compared to fiscal
2009.
Europe
Segment results for Europe include retail operations in 13 European countries and e-commerce operations in
five countries. As of January 29, 2011, the European segment operated 1,384 stores, compared to 1,296 stores as
of January 30, 2010. For the 52 weeks ended January 29, 2011, European sales decreased 3.2% compared to the
52 weeks ended January 30, 2010. This decrease in sales was due to the unfavorable impact of changes in
exchange rates in fiscal 2010, which had the effect of decreasing sales by $106.4 million when compared to fiscal
2009, and a decrease in sales at existing stores. The decrease in sales was partially offset by additional sales at
the 228 new stores opened since January 31, 2009. The decrease in sales at existing stores was primarily driven
by weak consumer traffic due to the continued macroeconomic weakness and lower hardware sales as a result of
a slow-down in hardware unit sell-through and lower price points when compared to fiscal 2009.
The segment operating income in Europe for fiscal 2010 increased by $1.0 million to $68.2 million
compared to $67.2 million in fiscal 2009. The increase in the operating income was primarily due to an increase
in gross margin, driven by an increase in used product sales, partially offset by the unfavorable impact of changes
in exchange rates, which had the effect of decreasing operating earnings by $6.5 million when compared to fiscal
2009.
43