GameStop 2006 Annual Report Download - page 86
Download and view the complete annual report
Please find page 86 of the 2006 GameStop annual report below. You can navigate through the pages in the report by either clicking on the pages listed below, or by using the keyword search tool below to find specific information within the annual report.-
 1
1 -
2
-
3
-
4
-
5
-
6
-
7
-
8
-
9
-
10
-
11
-
12
-
13
-
14
-
15
-
16
-
17
-
18
-
19
-
20
-
21
-
22
-
23
-
24
-
25
-
26
-
27
-
28
-
29
-
30
-
31
-
32
-
33
-
34
-
35
-
36
-
37
-
38
-
39
-
40
-
41
-
42
-
43
-
44
-
45
-
46
-
47
-
48
-
49
-
50
-
51
-
52
-
53
-
54
-
55
-
56
-
57
-
58
-
59
-
60
-
61
-
62
-
63
-
64
-
65
-
66
-
67
-
68
-
69
-
70
-
71
-
72
-
73
-
74
-
75
-
 76
76 -
 77
77 -
 78
78 -
 79
79 -
 80
80 -
 81
81 -
 82
82 -
 83
83 -
 84
84 -
 85
85 -
 86
86 -
 87
87 -
 88
88 -
 89
89 -
 90
90 -
 91
91 -
 92
92 -
 93
93 -
 94
94 -
 95
95 -
 96
96 -
97
-
98
-
99
-
100
-
101
-
102
-
103
-
104
-
105
-
106
-
107
-
108
-
109
-
110
-
111
-
112
-
113
-
114
-
115
-
116
 |
 |

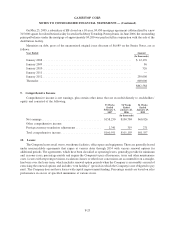
identifiable advertising and promotional costs to merchandise purchases. The Company then applied this ratio to the
value of inventory in determining the amount of vendor reimbursements to be recorded as a reduction to inventory
reflected on the balance sheet.
The cooperative advertising programs and other vendor marketing programs generally cover a period from a
few days up to a few weeks and include items such as product catalog advertising, in-store display promotions,
internet advertising, co-op print advertising, product training and promotion at the Company’s annual store
managers conference. The allowance for each event is negotiated with the vendor and requires specific performance
by the Company to be earned.
Vendor allowances received and netted against advertising expenses were $49,585 in the 53 weeks ended
February 3, 2007 and $32,161 and $21,913 in the 52 weeks ended January 28, 2006 and January 29, 2005,
respectively. Vendor allowances received in excess of advertising expenses were recorded as a reduction of cost of
sales of $117,082 for the 53 weeks ended February 3, 2007 and $74,690 and $29,917 for the 52 weeks ended
January 28, 2006 and January 29, 2005, respectively, less $1,377, $4,150 and $66, respectively, for the effect of the
amounts deferred as a reduction in inventory.
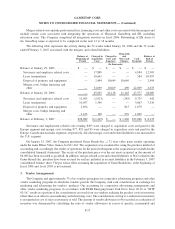
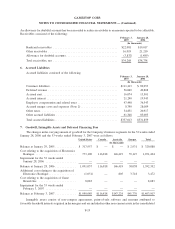
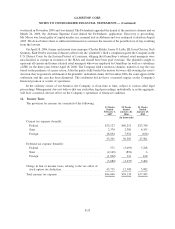
4. Computation of Net Earnings per Common Share
As of February 3, 2007 the Company had two classes of common stock. Subsequent to February 3, 2007, the
Company completed the Conversion and the Stock Split and now has only Class A common stock outstanding and
computed earnings per share in accordance with Statement of Financial Accounting Standards No. 128, Earnings
per Share. A reconciliation of shares used in calculating basic and diluted net earnings per common share follows:
53 Weeks
Ended
February 3,
2007
52 Weeks
Ended
January 28,
2006
52 Weeks
Ended
January 29,
2005
(In thousands, except per share data)
Net earnings ..................................... $158,250 $100,784 $ 60,926
Weighted average common shares outstanding ............ 149,924 115,840 109,324
Dilutive effect of options and warrants on common stock . . . 8,360 9,132 6,268
Common shares and dilutive potential common shares ...... 158,284 124,972 115,592
Net earnings per common share:
Basic .......................................... $ 1.06 $ 0.87 $ 0.56
Diluted......................................... $ 1.00 $ 0.81 $ 0.53
The following table contains information on restricted shares and options to purchase shares of Class A
common stock which were excluded from the computation of diluted earnings per share because they were anti-
dilutive:
Anti-
Dilutive
Shares
Range of
Exercise
Prices
Expiration
Dates
(In thousands, except per share data)
53 Weeks Ended February 3, 2007 ......................... 16 — 2009
52 Weeks Ended January 28, 2006 ......................... 240 $17.94 2015
52 Weeks Ended January 29, 2005 ......................... 60 $10.63 2012
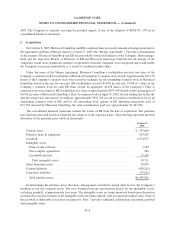
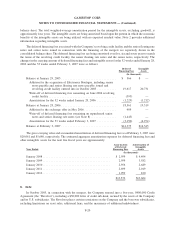
5. Receivables, Net
Receivables consist primarily of bankcard receivables and other receivables. Other receivables include
receivables from Game Informer magazine advertising customers, receivables from landlords for tenant allowances
and receivables from vendors for merchandise returns, vendor marketing allowances and various other programs.
F-18
GAMESTOP CORP.
NOTES TO CONSOLIDATED FINANCIAL STATEMENTS — (Continued)