GameStop 2006 Annual Report Download - page 43
Download and view the complete annual report
Please find page 43 of the 2006 GameStop annual report below. You can navigate through the pages in the report by either clicking on the pages listed below, or by using the keyword search tool below to find specific information within the annual report.-
 1
1 -
2
-
3
-
4
-
5
-
6
-
7
-
8
-
9
-
10
-
11
-
12
-
13
-
14
-
15
-
16
-
17
-
18
-
19
-
20
-
21
-
22
-
23
-
24
-
25
-
26
-
27
-
28
-
29
-
30
-
31
-
32
-
 33
33 -
 34
34 -
 35
35 -
 36
36 -
 37
37 -
 38
38 -
 39
39 -
 40
40 -
 41
41 -
 42
42 -
 43
43 -
 44
44 -
 45
45 -
 46
46 -
 47
47 -
 48
48 -
 49
49 -
 50
50 -
 51
51 -
 52
52 -
 53
53 -
54
-
55
-
56
-
57
-
58
-
59
-
60
-
61
-
62
-
63
-
64
-
65
-
66
-
67
-
68
-
69
-
70
-
71
-
72
-
73
-
74
-
75
-
76
-
77
-
78
-
79
-
80
-
81
-
82
-
83
-
84
-
85
-
86
-
87
-
88
-
89
-
90
-
91
-
92
-
93
-
94
-
95
-
96
-
97
-
98
-
99
-
100
-
101
-
102
-
103
-
104
-
105
-
106
-
107
-
108
-
109
-
110
-
111
-
112
-
113
-
114
-
115
-
116
 |
 |
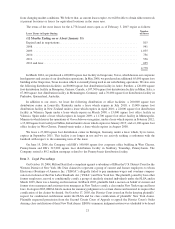
stockholders of record at the close of business on February 20, 2007, paid on March 16, 2007 (the “Stock Split”).
Unless otherwise indicated, all numbers in this Management’s Discussion and Analysis of Financial Condition and
Results of Operations have been restated to reflect the Conversion and the Stock Split.
Growth in the video game industry is driven by the introduction of new technology. In fiscal 2005 in the North
American markets, Sony introduced the PlayStation Portable (the “PSP”) in March and Microsoft introduced the
Xbox 360 in November. In November 2006, Nintendo introduced the Wii hardware platform worldwide and Sony
introduced the PlayStation 3 hardware platform in the North American markets. Typically, following the intro-
duction of new video game platforms, sales of new video game hardware increase as a percentage of sales in the first
full year following introduction. As video game platforms mature, the sales mix attributable to complementary
video game software and accessories, which generate higher gross margins, generally increases in the second and
third years. The net effect is generally a decline in gross margins in the first full year following new platform
releases and an increase in gross margins in the second and third years. Unit sales of maturing video game platforms
are typically also driven by manufacturer-funded retail price decreases, further driving sales of related software and
accessories. We expect that the installed base of the hardware platforms listed above and sales of related software
and accessories will increase in the future. The Company’s gross margin in fiscal 2006 was impacted by the recent
launches of these new products.
Critical Accounting Policies
The Company believes that the following are its most significant accounting policies which are important in
determining the reporting of transactions and events:
Use of Estimates. The preparation of financial statements in conformity with GAAP requires management to
make estimates and assumptions that affect the reported amounts of assets and liabilities, the disclosure of
contingent assets and liabilities at the date of the financial statements and the reported amounts of revenues and
expenses during the reporting period. In preparing these financial statements, management has made its best
estimates and judgments of certain amounts included in the financial statements, giving due consideration to
materiality. Changes in the estimates and assumptions used by management could have significant impact on the
Company’s financial results. Actual results could differ from those estimates.
Revenue Recognition. Revenue from the sales of the Company’s products is recognized at the time of sale.
The sales of used video game products are recorded at the retail price charged to the customer. Sales returns (which
are not significant) are recognized at the time returns are made. Subscription and advertising revenues are recorded
upon release of magazines for sale to consumers and are stated net of sales discounts. Magazine subscription
revenue is recognized on a straight-line basis over the subscription period. Revenue from the sales of product
replacement plans is recognized on a straight-line basis over the coverage period. Gift cards sold to customers are
recognized as a liability on the balance sheet until redeemed.
Stock-Based Compensation. In December 2004, the Financial Accounting Standards Board (“FASB”) issued
Statement of Financial Accounting Standards No. 123 (Revised 2004), Share-Based Payment, (“SFAS 123(R)”).
This Statement requires companies to expense the estimated fair value of stock options and similar equity
instruments issued to employees in its financial statements. The Company adopted the provisions of SFAS 123(R)
using the modified prospective application method beginning on the first day of fiscal 2006. Under SFAS 123(R),
the Company records stock-based compensation expense based on the grant-date fair value estimated in accordance
with the original provisions of Statement of Financial Accounting Standards No. 123, Accounting for Stock-Based
Compensation, and previously presented in the pro forma footnote disclosures, for all options granted prior to, but
not vested as of, the adoption date. In addition, the Company records compensation expense for the share-based
awards issued after the adoption date in accordance with SFAS 123(R). As of February 3, 2007, the unrecognized
compensation expense related to the unvested portion of our stock options and restricted stock was $21.7 million
and $8.2 million, respectively which is expected to be recognized over a weighted average period of 1.0 and
2.0 years, respectively. Note 1 of “Notes to Consolidated Financial Statements” provides additional information on
stock-based compensation.
Merchandise Inventories. Our merchandise inventories are carried at the lower of cost or market using the
average cost method. Used video game products traded in by customers are recorded as inventory at the amount of
28