GameStop 2006 Annual Report Download - page 41
Download and view the complete annual report
Please find page 41 of the 2006 GameStop annual report below. You can navigate through the pages in the report by either clicking on the pages listed below, or by using the keyword search tool below to find specific information within the annual report.-
 1
1 -
2
-
3
-
4
-
5
-
6
-
7
-
8
-
9
-
10
-
11
-
12
-
13
-
14
-
15
-
16
-
17
-
18
-
19
-
20
-
21
-
22
-
23
-
24
-
25
-
26
-
27
-
28
-
29
-
30
-
 31
31 -
 32
32 -
 33
33 -
 34
34 -
 35
35 -
 36
36 -
 37
37 -
 38
38 -
 39
39 -
 40
40 -
 41
41 -
 42
42 -
 43
43 -
 44
44 -
 45
45 -
 46
46 -
 47
47 -
 48
48 -
 49
49 -
 50
50 -
 51
51 -
52
-
53
-
54
-
55
-
56
-
57
-
58
-
59
-
60
-
61
-
62
-
63
-
64
-
65
-
66
-
67
-
68
-
69
-
70
-
71
-
72
-
73
-
74
-
75
-
76
-
77
-
78
-
79
-
80
-
81
-
82
-
83
-
84
-
85
-
86
-
87
-
88
-
89
-
90
-
91
-
92
-
93
-
94
-
95
-
96
-
97
-
98
-
99
-
100
-
101
-
102
-
103
-
104
-
105
-
106
-
107
-
108
-
109
-
110
-
111
-
112
-
113
-
114
-
115
-
116
 |
 |

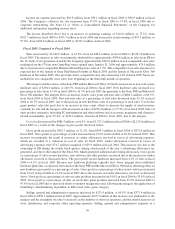
53 Weeks
Ended
February 3,
2007
52 Weeks
Ended
January 28,
2006(1)
52 Weeks
Ended
January 29,
2005
52 Weeks
Ended
January 31,
2004
52 Weeks
Ended
February 1,
2003
(In thousands, except per share data and statistical data)
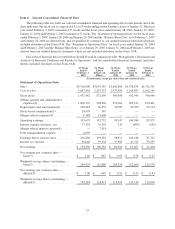
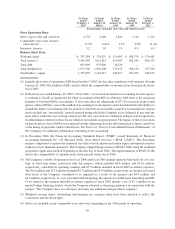
Store Operating Data:
Stores open at the end of period ......... 4,778 4,490 1,826 1,514 1,231
Comparable store sales increase
(decrease)(6) ..................... 11.9% (1.4)% 1.7% 0.8% 11.4%
Inventory turnover ................... 5.2 5.0 5.4 4.9 4.9
Balance Sheet Data:
Working capital ..................... $ 353,284 $ 234,293 $ 111,093 $ 188,378 $ 174,482
Total assets(2) ...................... 3,349,584 3,015,821 915,983 902,189 806,237
Total debt ......................... 855,899 975,990 36,520 — —
Total liabilities(2) .................... 1,973,706 1,901,108 372,972 308,156 257,562
Stockholders’ equity .................. 1,375,878 1,114,713 543,011 594,033 548,675
(1) Includes the results of operations of EB from October 9, 2005, the day after completion of the mergers, through
January 28, 2006. The addition of EB’s results affects the comparability of amounts from fiscal periods before
fiscal 2005.
(2) In the fiscal year ended January 29, 2005 (“fiscal 2004”), we revised our method of accounting for rent expense
to conform to GAAP, as clarified by the Chief Accountant of the SEC in a February 2005 letter to the American
Institute of Certified Public Accountants. A non-cash, after-tax adjustment of $3,312 was made in the fourth
quarter of fiscal 2004 to correct the method of accounting for rent expense (and related deferred rent liability) to
include the impact of escalating rents for periods in which we are reasonably assured of exercising lease options
and to include any “rent holiday” period (a period during which the Company is not obligated to pay rent) the
lease allows while the store is being constructed. We also corrected our calculation of depreciation expense for
leasehold improvements for those leases which do not include an option period. The impact of these corrections
on periods prior to fiscal 2004 was not material and the adjustment does not affect historical or future cash flows
or the timing of payments under related leases. See Note 1 of “Notes to Consolidated Financial Statements” of
the Company for additional information concerning lease accounting.
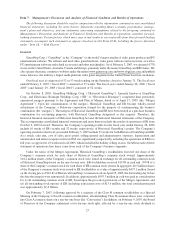
(3) In December 2004, the Financial Accounting Standards Board (“FASB”) issued Statement of Financial
Accounting Standards No. 123 (Revised 2004), Share-Based Payment, (“SFAS 123(R)”). This Statement
requires companies to expense the estimated fair value of stock options and similar equity instruments issued to
employees in its financial statements. The Company adopted the provisions of SFAS 123(R) using the modified
prospective application method beginning on the first day of fiscal 2006. The implementation of SFAS 123(R)
affects the comparability of amounts from fiscal periods before fiscal 2006.
(4) The Company’s results of operations for fiscal 2006 and fiscal 2005 include expenses believed to be of a one-
time or short-term nature associated with the mergers, which included $6.8 million and $13.6 million,
respectively, considered in operating earnings and $7.5 million included in fiscal 2005 in interest expenses.
The $6.8 million and $13.6 million included $1.9 million and $9.0 million, respectively, in charges associated
with assets of the Company considered to be impaired as a result of the mergers and $4.9 million and
$4.6 million, respectively, in costs associated with integrating the operations of Historical GameStop and EB.
Costs related to the mergers included in interest expense in fiscal 2005 include a fee of $7.1 million for an
unused bridge financing facility which the Company obtained as financing insurance in connection with the
mergers. The Company does not anticipate incurring any additional merger-related expenses.
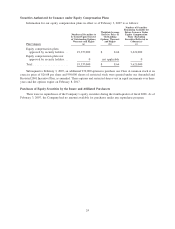
(5) Weighted average shares outstanding and earnings per common share have been adjusted to reflect the
Conversion and the Stock Split.
(6) Stores are included in our comparable store sales base beginning in the 13th month of operation.
26