GameStop 2006 Annual Report Download - page 10
Download and view the complete annual report
Please find page 10 of the 2006 GameStop annual report below. You can navigate through the pages in the report by either clicking on the pages listed below, or by using the keyword search tool below to find specific information within the annual report.-
 1
1 -
 2
2 -
 3
3 -
 4
4 -
 5
5 -
 6
6 -
 7
7 -
 8
8 -
 9
9 -
 10
10 -
 11
11 -
 12
12 -
 13
13 -
 14
14 -
 15
15 -
 16
16 -
 17
17 -
 18
18 -
 19
19 -
 20
20 -
 21
21 -
22
-
23
-
24
-
25
-
26
-
27
-
28
-
29
-
30
-
31
-
32
-
33
-
34
-
35
-
36
-
37
-
38
-
39
-
40
-
41
-
42
-
43
-
44
-
45
-
46
-
47
-
48
-
49
-
50
-
51
-
52
-
53
-
54
-
55
-
56
-
57
-
58
-
59
-
60
-
61
-
62
-
63
-
64
-
65
-
66
-
67
-
68
-
69
-
70
-
71
-
72
-
73
-
74
-
75
-
76
-
77
-
78
-
79
-
80
-
81
-
82
-
83
-
84
-
85
-
86
-
87
-
88
-
89
-
90
-
91
-
92
-
93
-
94
-
95
-
96
-
97
-
98
-
99
-
100
-
101
-
102
-
103
-
104
-
105
-
106
-
107
-
108
-
109
-
110
-
111
-
112
-
113
-
114
-
115
-
116
 |
 |
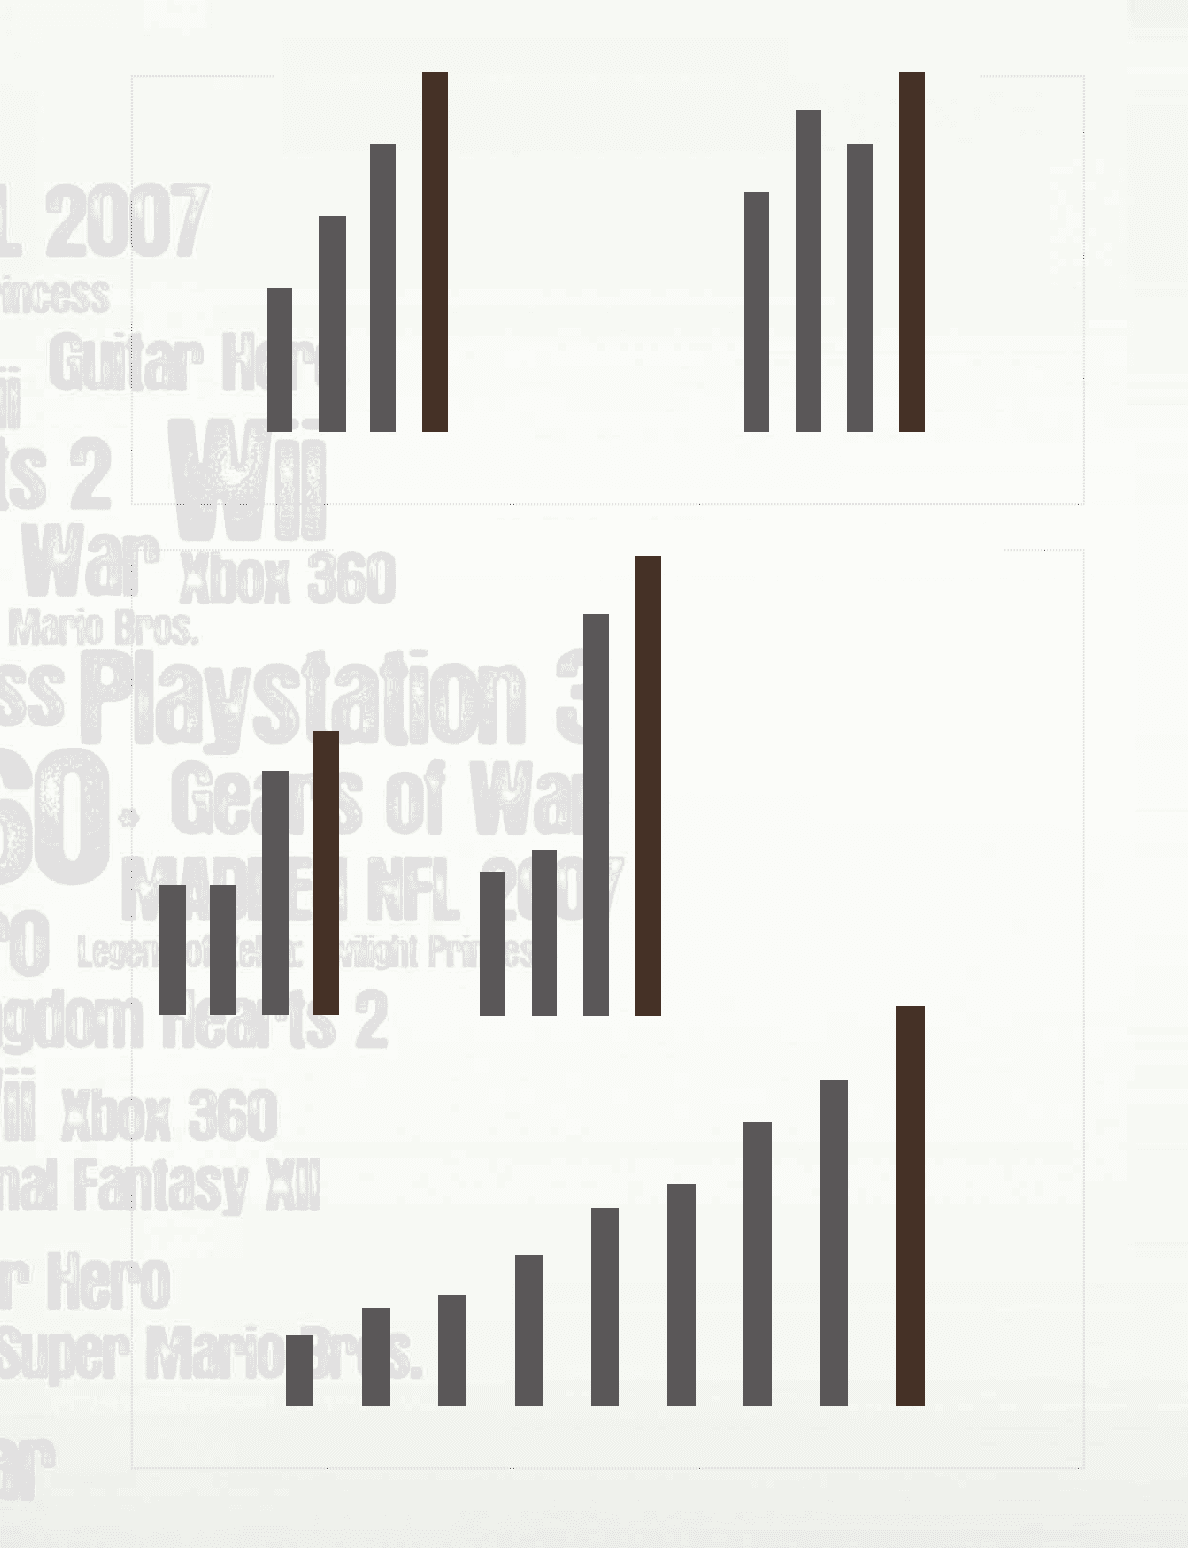
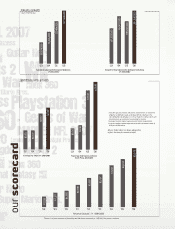
gamestop corp. growth
All per share data has been adjusted to
reect the two-for-one stock split
Source: NPD Group
industry growth
Growth In Installed Video Game Hardware,
CY 2003-2006
56,838,000
76,635,000
97,484,000
127,584,000
‘06‘05‘04‘03
Growth In New Video Game Software Units Sold,
CY 2003-2006
167,623,000
194,412,000
188,243,000
201,390,000
‘03 ‘04 ‘05 ‘06
Fiscal Year End Class A Common
Stock Price, 2003-2006
$26.95
‘06
$19.57
‘05‘04
$9.40
‘03
$8.30
1
1 1
Earnings Per Share, FY 2003-2006
‘03
$0.53
‘04 ‘06‘05
$1.00 4
$0.81 3
$0.53 2
Includes special charges of $.05 per diluted share for California
litigation settlement costs, professional fees relating to the
spin-off by Barnes & Noble, Inc. of our Class B common stock and
the change in our method of accounting for leases.
Includes merger-related expenses of $.10 per diluted share.
Includes merger-related expenses and debt retirement costs of
$.05 per diluted share.
2
3
4
Source: Pro forma revenues of GameStop and EB Games combined for 1998-2005. Numbers in millions.
5
Revenue Growth , FY 1998-2006
$5,319
‘06
$4,394
‘05
$3,827
‘04
$3,167
‘03
$2,662
‘02
$2,180
‘01
$1,560
‘00
$1,311
‘99
$1,036
‘98
5
our scorecard