GameStop 2006 Annual Report Download - page 71
Download and view the complete annual report
Please find page 71 of the 2006 GameStop annual report below. You can navigate through the pages in the report by either clicking on the pages listed below, or by using the keyword search tool below to find specific information within the annual report.-
 1
1 -
2
-
3
-
4
-
5
-
6
-
7
-
8
-
9
-
10
-
11
-
12
-
13
-
14
-
15
-
16
-
17
-
18
-
19
-
20
-
21
-
22
-
23
-
24
-
25
-
26
-
27
-
28
-
29
-
30
-
31
-
32
-
33
-
34
-
35
-
36
-
37
-
38
-
39
-
40
-
41
-
42
-
43
-
44
-
45
-
46
-
47
-
48
-
49
-
50
-
51
-
52
-
53
-
54
-
55
-
56
-
57
-
58
-
59
-
60
-
 61
61 -
 62
62 -
 63
63 -
 64
64 -
 65
65 -
 66
66 -
 67
67 -
 68
68 -
 69
69 -
 70
70 -
 71
71 -
 72
72 -
 73
73 -
 74
74 -
 75
75 -
 76
76 -
 77
77 -
 78
78 -
 79
79 -
 80
80 -
 81
81 -
82
-
83
-
84
-
85
-
86
-
87
-
88
-
89
-
90
-
91
-
92
-
93
-
94
-
95
-
96
-
97
-
98
-
99
-
100
-
101
-
102
-
103
-
104
-
105
-
106
-
107
-
108
-
109
-
110
-
111
-
112
-
113
-
114
-
115
-
116
 |
 |

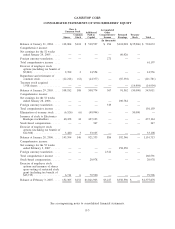
GAMESTOP CORP.
CONSOLIDATED BALANCE SHEETS
February 3,
2007
January 28,
2006
(In thousands)
ASSETS
Current assets:
Cash and cash equivalents . ........................................... $ 652,403 $ 401,593
Receivables, net . . . ................................................ 34,268 38,738
Merchandise inventories, net .......................................... 675,385 603,178
Prepaid expenses and other current assets . ................................ 37,882 16,339
Prepaid taxes ..................................................... 5,545 21,068
Deferred taxes .................................................... 34,858 41,051
Total current assets ............................................... 1,440,341 1,121,967
Property and equipment:
Land ........................................................... 10,712 10,257
Buildings and leasehold improvements . . . ................................ 305,806 262,908
Fixtures and equipment . . . ........................................... 425,841 343,897
742,359 617,062
Less accumulated depreciation and amortization . ........................... 285,896 184,937
Net property and equipment . . . ...................................... 456,463 432,125
Goodwill, net . ...................................................... 1,403,907 1,392,352
Assets held for sale . . ................................................ — 19,297
Deferred financing fees................................................ 14,375 18,561
Deferred taxes ...................................................... 5,804 —
Other noncurrent assets................................................ 28,694 31,519
Total other assets ................................................ 1,452,780 1,461,729
Total assets ..................................................... $3,349,584 $3,015,821
LIABILITIES AND STOCKHOLDERS’ EQUITY
Current liabilities:
Accounts payable . . ................................................ $ 717,868 $ 543,288
Accrued liabilities. . ................................................ 357,013 331,859
Notes payable, current portion . . . ...................................... 12,176 12,527
Total current liabilities. . ........................................... 1,087,057 887,674
Deferred taxes ...................................................... — 13,640
Senior notes payable, long-term portion, net . ................................ 593,311 641,788
Senior floating rate notes payable, long-term portion .......................... 250,000 300,000
Note payable, long-term portion . . . ...................................... 412 21,675
Deferred rent and other long-term liabilities . ................................ 42,926 36,331
Total long-term liabilities ........................................... 886,649 1,013,434
Total liabilities . . ................................................ 1,973,706 1,901,108
Commitments and contingencies (Notes 10 and 11)
Stockholders’ equity:
Preferred stock — authorized 5,000 shares; no shares issued or outstanding . . . ..... — —
Class A common stock — $.001 par value; authorized 300,000 shares; 152,305 and
145,594 shares issued and outstanding, respectively ........................ 152 146
Additional paid-in-capital . ........................................... 1,021,903 921,335
Accumulated other comprehensive income ................................ 3,227 886
Retained earnings . . ................................................ 350,596 192,346
Total stockholders’ equity . ......................................... 1,375,878 1,114,713
Total liabilities and stockholders’ equity . . .............................. $3,349,584 $3,015,821
See accompanying notes to consolidated financial statements.
F-3