GameStop 2006 Annual Report Download - page 11
Download and view the complete annual report
Please find page 11 of the 2006 GameStop annual report below. You can navigate through the pages in the report by either clicking on the pages listed below, or by using the keyword search tool below to find specific information within the annual report.-
 1
1 -
 2
2 -
 3
3 -
 4
4 -
 5
5 -
 6
6 -
 7
7 -
 8
8 -
 9
9 -
 10
10 -
 11
11 -
 12
12 -
 13
13 -
 14
14 -
 15
15 -
 16
16 -
 17
17 -
 18
18 -
 19
19 -
 20
20 -
 21
21 -
 22
22 -
23
-
24
-
25
-
26
-
27
-
28
-
29
-
30
-
31
-
32
-
33
-
34
-
35
-
36
-
37
-
38
-
39
-
40
-
41
-
42
-
43
-
44
-
45
-
46
-
47
-
48
-
49
-
50
-
51
-
52
-
53
-
54
-
55
-
56
-
57
-
58
-
59
-
60
-
61
-
62
-
63
-
64
-
65
-
66
-
67
-
68
-
69
-
70
-
71
-
72
-
73
-
74
-
75
-
76
-
77
-
78
-
79
-
80
-
81
-
82
-
83
-
84
-
85
-
86
-
87
-
88
-
89
-
90
-
91
-
92
-
93
-
94
-
95
-
96
-
97
-
98
-
99
-
100
-
101
-
102
-
103
-
104
-
105
-
106
-
107
-
108
-
109
-
110
-
111
-
112
-
113
-
114
-
115
-
116
 |
 |

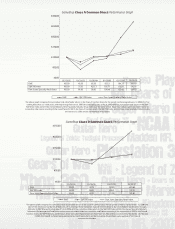
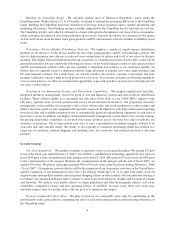
GameStop Class B Common Stock Performance Graph
The above graph compares the cumulative total stockholder return on the Class B Common Stock for the period commencing November 12, 2004 (the
date of the distribution by Barnes & Noble, Inc. of its holdings of the Company’s Class B Common Stock to Barnes & Noble’s stockholders) through
February 2, 2007 (the last trading date of scal 2006) with the cumulative total return on the S&P 500 Index and the Dow Jones Specialty Retailers
Index over the same period. Total return values were calculated based on cumulative total return assuming (i) the investment of $100 in the Class B
Common Stock, the S&P 500 Index and the Dow Jones Specialty Retailers Index on November 12, 2004 and (ii) reinvestment of dividends. On February
7, 2007, the Class B Common Stock was converted into Class A Common Stock on a one-for-one basis upon approval of the Class B
common stockholders.
$250.00
$200.00
$150.00
$100.00
$50.00
$0.00
Dow Jones Specialty Retail Index 100.00 96.30 111.69 121.96
11/12/04 01/28/05 01/27/06 02/02/07
S&P 500 Index 100.00 98.92 108.41 122.31
GME 100.00 78.13 150.83 223.96
S&P 500 IndexGME Dow Jones Specialty Retail Index
GameStop Class A Common Stock Performance Graph
The above graph compares the cumulative total stockholder return on the Class A Common Stock for the period commencing February 13, 2002 (the rst
trading date after our initial public offering) through February 2, 2007 (the last trading date of scal 2006) with the cumulative total return on the S&P
500 Stock Index and the Dow Jones Retailers, Other Specialty Industry Group Index over the same period. Total return values were calculated based on
cumulative total return assuming (i) the investment of $100 in the Class A Common Stock, the S&P 500 Index and the Dow Jones Specialty Retailers Index
on February 13, 2002 and (ii) reinvestment of dividends.
$300.00
$250.00
$200.00
$150.00
$100.00
$50.00
$0.00
Dow Jones Specialty Retail Index 100.00 61.88 98.96 106.40 123.40 134.75
02/13/02 01/31/03 01/30/04 01/28/05 01/27/06 02/02/07
S&P 500 Index 100.00 77.26 102.13 105.77 115.91 130.78
GME 100.00 42.29 82.59 93.53 194.73 268.16
S&P 500 IndexGME Dow Jones Specialty Retail Index