GameStop 2006 Annual Report Download - page 110
Download and view the complete annual report
Please find page 110 of the 2006 GameStop annual report below. You can navigate through the pages in the report by either clicking on the pages listed below, or by using the keyword search tool below to find specific information within the annual report.-
 1
1 -
2
-
3
-
4
-
5
-
6
-
7
-
8
-
9
-
10
-
11
-
12
-
13
-
14
-
15
-
16
-
17
-
18
-
19
-
20
-
21
-
22
-
23
-
24
-
25
-
26
-
27
-
28
-
29
-
30
-
31
-
32
-
33
-
34
-
35
-
36
-
37
-
38
-
39
-
40
-
41
-
42
-
43
-
44
-
45
-
46
-
47
-
48
-
49
-
50
-
51
-
52
-
53
-
54
-
55
-
56
-
57
-
58
-
59
-
60
-
61
-
62
-
63
-
64
-
65
-
66
-
67
-
68
-
69
-
70
-
71
-
72
-
73
-
74
-
75
-
76
-
77
-
78
-
79
-
80
-
81
-
82
-
83
-
84
-
85
-
86
-
87
-
88
-
89
-
90
-
91
-
92
-
93
-
94
-
95
-
96
-
97
-
98
-
99
-
 100
100 -
 101
101 -
 102
102 -
 103
103 -
 104
104 -
 105
105 -
 106
106 -
 107
107 -
 108
108 -
 109
109 -
 110
110 -
 111
111 -
 112
112 -
 113
113 -
 114
114 -
 115
115 -
 116
116
 |
 |

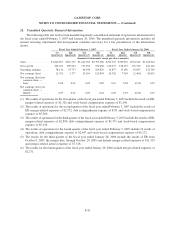
22. Unaudited Quarterly Financial Information
The following table sets forth certain unaudited quarterly consolidated statement of operations information for
the fiscal years ended February 3, 2007 and January 28, 2006. The unaudited quarterly information includes all
normal recurring adjustments that management considers necessary for a fair presentation of the information
shown.
1st
Quarter(1)
2nd
Quarter(2)
3rd
Quarter(3)
4th
Quarter(4)
1st
Quarter
2nd
Quarter
3rd
Quarter(5)
4th
Quarter(6)
Fiscal Year Ended February 3, 2007 Fiscal Year Ended January 28, 2006
(Amounts in thousands, except per share amounts)
Sales . . . . . . . . . . . . . . . $1,040,027 $963,347 $1,011,560 $2,303,966 $474,727 $415,930 $534,212 $1,666,914
Gross profit . . . . . . . . . . 302,034 299,264 315,656 554,488 126,037 128,155 176,720 441,118
Operating earnings . . . . . 38,116 25,753 44,940 224,870 16,857 13,190 10,095 152,590
Net earnings (loss) . . . . . 11,701 3,177 13,569 129,803 10,326 7,903 (2,460) 85,015
Net earnings (loss) per
common share —
basic . . . . . . . . . . . . . 0.08 0.02 0.09 0.85 0.10 0.08 (0.02) 0.59
Net earnings (loss) per
common share —
diluted . . . . . . . . . . . . 0.07 0.02 0.09 0.81 0.09 0.07 (0.02) 0.55
(1) The results of operations for the first quarter of the fiscal year ended February 3, 2007 include the results of EB,
merger-related expenses of $1,326 and stock-based compensation expense of $5,190.
(2) The results of operations for the second quarter of the fiscal year ended February 3, 2007 include the results of
EB, merger-related expenses of $2,572, debt extinguishment expense of $191 and stock-based compensation
expense of $5,360.
(3) The results of operations for the third quarter of the fiscal year ended February 3, 2007 include the results of EB,
merger-related expenses of $2,890, debt extinguishment expense of $3,371 and stock-based compensation
expense of $5,156.
(4) The results of operations for the fourth quarter of the fiscal year ended February 3, 2007 include 14 weeks of
operations, debt extinguishment expense of $2,497 and stock-based compensation expense of $5,272.
(5) The results for the third quarter of the fiscal year ended January 28, 2006 include the results of EB from
October 9, 2005, the merger date, through October 29, 2005 and include merger-related expenses of $11,329
and merger-related interest expense of $7,518.
(6) The results for the fourth quarter of the fiscal year ended January 28, 2006 include merger-related expenses of
$2,271.
F-42
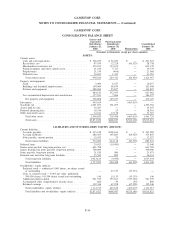
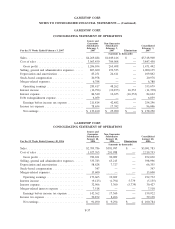
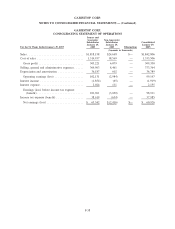
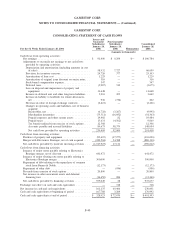
GAMESTOP CORP.
NOTES TO CONSOLIDATED FINANCIAL STATEMENTS — (Continued)