GameStop 2006 Annual Report Download - page 51
Download and view the complete annual report
Please find page 51 of the 2006 GameStop annual report below. You can navigate through the pages in the report by either clicking on the pages listed below, or by using the keyword search tool below to find specific information within the annual report.-
 1
1 -
2
-
3
-
4
-
5
-
6
-
7
-
8
-
9
-
10
-
11
-
12
-
13
-
14
-
15
-
16
-
17
-
18
-
19
-
20
-
21
-
22
-
23
-
24
-
25
-
26
-
27
-
28
-
29
-
30
-
31
-
32
-
33
-
34
-
35
-
36
-
37
-
38
-
39
-
40
-
 41
41 -
 42
42 -
 43
43 -
 44
44 -
 45
45 -
 46
46 -
 47
47 -
 48
48 -
 49
49 -
 50
50 -
 51
51 -
 52
52 -
 53
53 -
 54
54 -
 55
55 -
 56
56 -
 57
57 -
 58
58 -
 59
59 -
 60
60 -
 61
61 -
62
-
63
-
64
-
65
-
66
-
67
-
68
-
69
-
70
-
71
-
72
-
73
-
74
-
75
-
76
-
77
-
78
-
79
-
80
-
81
-
82
-
83
-
84
-
85
-
86
-
87
-
88
-
89
-
90
-
91
-
92
-
93
-
94
-
95
-
96
-
97
-
98
-
99
-
100
-
101
-
102
-
103
-
104
-
105
-
106
-
107
-
108
-
109
-
110
-
111
-
112
-
113
-
114
-
115
-
116
 |
 |
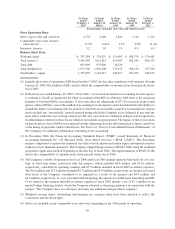
Income tax expense increased by $36.9 million, from $59.1 million in fiscal 2005 to $96.0 million in fiscal
2006. The Company’s effective tax rate increased from 37.0% in fiscal 2005 to 37.8% in fiscal 2006 due to
corporate restructuring. See Note 12 of “Notes to Consolidated Financial Statements” of the Company for
additional information regarding income taxes.
The factors described above led to an increase in operating earnings of $141.0 million, or 73.2%, from
$192.7 million in fiscal 2005 to $333.7 million in fiscal 2006 and an increase in net earnings of $57.5 million, or
57.0%, from $100.8 million in fiscal 2005 to $158.3 million in fiscal 2006.
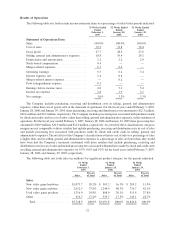
Fiscal 2005 Compared to Fiscal 2004
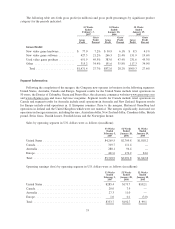
Sales increased by $1,249.0 million, or 67.8%, from $1,842.8 million in fiscal 2004 to $3,091.8 million in
fiscal 2005. The increase in sales was primarily attributable to approximately $996.8 million in sales from EB for
the 16 weeks of its operations owned by the Company, approximately $216.0 million in non-comparable store sales
resulting from the 574 net new GameStop stores opened since January 31, 2004 and approximately $29.6 million
due to an increase in comparable Historical GameStop store sales of 1.7%. This comparable store sales increase was
expected due to the launch of Sony PlayStation Portable in March 2005 and the launch of Microsoft Xbox 360
hardware in November 2005. On a pro forma basis, comparable store sales decreased 1.4% in fiscal 2005. Stores are
included in our comparable store sales base beginning in the thirteenth month of operation.
The mergers and the release of the Sony PSP and the Microsoft Xbox 360 led to an increase in new video game
hardware sales of $294.0 million, or 140.5%, from fiscal 2004 to fiscal 2005. New hardware sales increased as a
percentage of sales from 11.4% in fiscal 2004 to 16.3% in fiscal 2005 due primarily to the Sony PSP and Microsoft
Xbox 360 launches. The mergers led to an increase in new video game software sales of $468.2 million, or 60.3%,
from fiscal 2004 to fiscal 2005. New software sales as a percentage of total sales decreased from 42.1% in fiscal
2004 to 40.3% in fiscal 2005, due to the increase in new hardware sales as a percentage of total sales. Used video
game product sales also grew due to an increase in store count, efforts to increase the supply of used inventory
available for sale and the mergers, with an increase in sales of $296.2 million, or 57.9%, from fiscal 2004. Sales of
other product categories, including PC entertainment and other software and accessories, magazines and character-
related merchandise, grew 55.2%, or $190.6 million, from fiscal 2004 to fiscal 2005, due to the mergers.
Cost of sales increased by $886.3 million, or 66.5%, from $1,333.5 million in fiscal 2004 to $2,219.8 million in
fiscal 2005 as a result of the changes in gross profit discussed below.
Gross profit increased by $362.7 million, or 71.2%, from $509.3 million in fiscal 2004 to $872.0 million in
fiscal 2005. Gross profit as a percentage of sales increased from 27.6% in fiscal 2004 to 28.2% in fiscal 2005. This
increase was primarily the result of increases in vendor allowances received in excess of advertising expenses,
which are recorded as a reduction in cost of sales. In fiscal 2005, vendor allowances received in excess of
advertising expenses were $74.7 million compared to $29.9 million in fiscal 2004. This increase was due to the
ownership of EB during the fourth fiscal quarter, during which much of the year’s advertising allowances are
generated, and due to the launch of the Xbox 360, which generated additional advertising allowances. Gross profit
as a percentage of sales on new hardware, new software and other products increased due to the increase in vendor
allowances received as discussed above. The gross profit on new hardware increased from 4.1% of sales in fiscal
2004 to 6.1% in fiscal 2005. Because new hardware platforms typically have lower margins than established
hardware platforms, as expected, the launch of the Sony PSP and the Microsoft Xbox 360 had an offsetting effect on
new hardware gross profit as a percentage of sales. Gross profit as a percentage of sales on new software increased
from 19.6% in fiscal 2004 to 21.4% in fiscal 2005 due to the increase in vendor allowances received, as discussed
above. Gross profit as a percentage of sales on other products increased from 34.0% in fiscal 2004 to 35.8% in fiscal
2005. Gross profit as a percentage of sales on used video game products increased from 45.3% in fiscal 2004 to
47.4% in fiscal 2005 due to increased efforts to monitor margin rates and, following the mergers, the application of
GameStop’s merchandising algorithms to EB’s used video game category.
Selling, general and administrative expenses increased by $225.9 million, or 60.5%, from $373.4 million in
fiscal 2004 to $599.3 million in fiscal 2005. Approximately $165.9 million of this increase was attributable to the
mergers and the remainder was due to increases in the number of stores in operation, and the related increases in
store, distribution, and corporate office operating expenses. Selling, general and administrative expenses as a
36