GameStop 2006 Annual Report Download - page 22
Download and view the complete annual report
Please find page 22 of the 2006 GameStop annual report below. You can navigate through the pages in the report by either clicking on the pages listed below, or by using the keyword search tool below to find specific information within the annual report.-
 1
1 -
2
-
3
-
4
-
5
-
6
-
7
-
8
-
9
-
10
-
11
-
 12
12 -
 13
13 -
 14
14 -
 15
15 -
 16
16 -
 17
17 -
 18
18 -
 19
19 -
 20
20 -
 21
21 -
 22
22 -
 23
23 -
 24
24 -
 25
25 -
 26
26 -
 27
27 -
 28
28 -
 29
29 -
 30
30 -
 31
31 -
 32
32 -
33
-
34
-
35
-
36
-
37
-
38
-
39
-
40
-
41
-
42
-
43
-
44
-
45
-
46
-
47
-
48
-
49
-
50
-
51
-
52
-
53
-
54
-
55
-
56
-
57
-
58
-
59
-
60
-
61
-
62
-
63
-
64
-
65
-
66
-
67
-
68
-
69
-
70
-
71
-
72
-
73
-
74
-
75
-
76
-
77
-
78
-
79
-
80
-
81
-
82
-
83
-
84
-
85
-
86
-
87
-
88
-
89
-
90
-
91
-
92
-
93
-
94
-
95
-
96
-
97
-
98
-
99
-
100
-
101
-
102
-
103
-
104
-
105
-
106
-
107
-
108
-
109
-
110
-
111
-
112
-
113
-
114
-
115
-
116
 |
 |

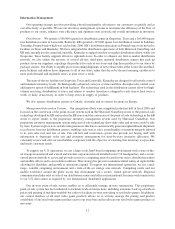
•Capitalize on Growth in Demand. Our sales of new video game hardware, new video game software and
used video game products grew by approximately 140%, 60% and 58%, respectively, in fiscal 2005 and by
an additional 113%, 62% and 63%, respectively, in fiscal 2006, due primarily to the mergers. Comparable
store sales on a pro forma basis for Historical GameStop and EB decreased 1.4% in fiscal 2005, due to soft
demand leading up to the U.S. launch of the Microsoft Xbox 360 in November 2005. In fiscal 2006, our
comparable store sales increased 11.9%, driven in large measure by the North American launch of the Sony
PlayStation 3 and the worldwide launch of the Nintendo Wii, which were launched in November 2006, and
the availability of the Microsoft Xbox 360 in all markets. During fiscal 2005, despite limited supplies of the
Microsoft Xbox 360, we capitalized on the demand for video game software and accessories that followed
that launch and the launch in March 2005 of the Sony PlayStation Portable. During fiscal 2006, despite again
facing limited supplies of the newly launched Sony PlayStation 3 and Nintendo Wii, we capitalized on the
demand for these new video game systems and the related video game software and accessories that
followed these launches. Over the next few years, we expect to continue to capitalize on the increasing
installed base for these latest generation platforms and the related growth in video game software and
accessories sales.
•Increase Sales of Used Video Game Products. We will continue to expand the selection and availability of
used video game products in our U.S. and international stores. Our strategy consists of increasing consumer
awareness of the benefits of trading in and buying used video game products at our stores through increased
marketing activities. We expect the continued growth of new platform technology to drive trade-ins of
previous generation products, as well as next generation platforms, thereby expanding the supply of used
video game products.
•Increase GameStop Brand Awareness. We intend to increase customer awareness of the GameStop brand.
In connection with our brand-building efforts, in each of the last three fiscal years, we increased the amount
of media advertising in targeted markets. In fiscal 2007, we plan to continue to increase media advertising, to
expand our GameStop loyalty card program, to aggressively promote trade-ins of used video game products
in our stores and to leverage our web sites at www.gamestop.com and www.ebgames.com.
Merchandise
Substantially all of our revenues are derived from the sale of tangible products. Our product offerings consist of
new and used video game products, PC entertainment software, and related products, such as trading cards and
strategy guides. Our in-store inventory generally consists of a constantly changing selection of over 5,000 SKUs.
We have buying groups in the U.S., Canada, Australia and Europe that negotiate terms, discounts and cooperative
advertising allowances for the stores in their respective geographic areas. We use customer requests and feedback,
advance orders, industry magazines and product reviews to determine which new releases are expected to be hits.
Advance orders are tracked at individual stores to distribute titles and capture demand effectively. This merchandise
management is essential because a significant portion of a game’s sales are usually generated in the first days and
weeks following its release.
Video Game Software. We purchase new video game software directly from the leading manufacturers,
including Sony Computer Entertainment of America, Nintendo of America, Inc. and Microsoft Corp., as well as
over 40 third-party game publishers, such as Electronic Arts, Inc. and Activision, Inc. We are one of the largest
customers of video game titles sold by these publishers. We generally carry over 1,000 SKUs of new video game
software at any given time across a variety of genres, including Sports, Action, Strategy, Adventure/Role Playing
and Simulation.
Used Video Game Products. We are the largest retailer of used video games in the world. We provide our
customers with an opportunity to trade in their used video game products in our stores in exchange for store credits
which can be applied towards the purchase of other products, primarily new merchandise. We have the largest
selection (approximately 3,500 SKUs) of used video game titles which have an average price of $14 as compared to
an average price of $36 for new video game titles and which generate significantly higher gross margins than new
video game products. Our trade-in program provides our customers with a unique value proposition which is
generally unavailable at mass merchants, toy stores and consumer electronics retailers. This program provides us
7