GameStop 2006 Annual Report Download - page 74
Download and view the complete annual report
Please find page 74 of the 2006 GameStop annual report below. You can navigate through the pages in the report by either clicking on the pages listed below, or by using the keyword search tool below to find specific information within the annual report.-
 1
1 -
2
-
3
-
4
-
5
-
6
-
7
-
8
-
9
-
10
-
11
-
12
-
13
-
14
-
15
-
16
-
17
-
18
-
19
-
20
-
21
-
22
-
23
-
24
-
25
-
26
-
27
-
28
-
29
-
30
-
31
-
32
-
33
-
34
-
35
-
36
-
37
-
38
-
39
-
40
-
41
-
42
-
43
-
44
-
45
-
46
-
47
-
48
-
49
-
50
-
51
-
52
-
53
-
54
-
55
-
56
-
57
-
58
-
59
-
60
-
61
-
62
-
63
-
 64
64 -
 65
65 -
 66
66 -
 67
67 -
 68
68 -
 69
69 -
 70
70 -
 71
71 -
 72
72 -
 73
73 -
 74
74 -
 75
75 -
 76
76 -
 77
77 -
 78
78 -
 79
79 -
 80
80 -
 81
81 -
 82
82 -
 83
83 -
 84
84 -
85
-
86
-
87
-
88
-
89
-
90
-
91
-
92
-
93
-
94
-
95
-
96
-
97
-
98
-
99
-
100
-
101
-
102
-
103
-
104
-
105
-
106
-
107
-
108
-
109
-
110
-
111
-
112
-
113
-
114
-
115
-
116
 |
 |

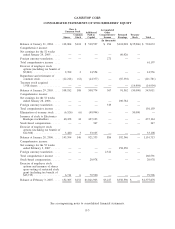
GAMESTOP CORP.
CONSOLIDATED STATEMENTS OF CASH FLOWS
53 Weeks
Ended
February 3,
2007
52 Weeks
Ended
January 28,
2006
52 Weeks
Ended
January 29,
2005
(In thousands)
Cash flows from operating activities:
Net earnings . . . . . . . . . . . . . . . . . . . . . . . . . . . . . . . . . . . . . . . . . . . . . . $ 158,250 $ 100,784 $ 60,926
Adjustments to reconcile net earnings to net cash flows provided by operating
activities:
Depreciation and amortization (including amounts in cost of sales) . . . . . . 110,176 66,659 37,019
Provision for inventory reserves . . . . . . . . . . . . . . . . . . . . . . . . . . . . . . . 50,779 25,103 17,808
Amortization and retirement of deferred financing fees . . . . . . . . . . . . . . . 4,595 1,229 432
Amortization and retirement of original issue discount on senior notes . . . . 1,523 316 —
Stock-based compensation expense. . . . . . . . . . . . . . . . . . . . . . . . . . . . . 20,978 347 —
Deferred taxes . . . . . . . . . . . . . . . . . . . . . . . . . . . . . . . . . . . . . . . . . . . (3,080) (3,675) 5,402
Loss on disposal and impairment of property and equipment . . . . . . . . . . . 4,261 11,648 382
Increase in deferred rent and other long-term liabilities . . . . . . . . . . . . . . . 9,702 3,669 5,349
Increase in liability to landlords for tenant allowances, net . . . . . . . . . . . . 1,602 202 1,644
Minority interest . . . . . . . . . . . . . . . . . . . . . . . . . . . . . . . . . . . . . . . . . — — (96)
Decrease in value of foreign exchange contracts. . . . . . . . . . . . . . . . . . . . (4,450) (2,421) —
Changes in operating assets and liabilities, net of business acquired
Receivables, net . . . . . . . . . . . . . . . . . . . . . . . . . . . . . . . . . . . . . . . . 2,866 (9,995) (267)
Merchandise inventories . . . . . . . . . . . . . . . . . . . . . . . . . . . . . . . . . . (118,417) (91,363) (10,578)
Prepaid expenses and other current assets . . . . . . . . . . . . . . . . . . . . . . (21,543) 19,484 (4,060)
Prepaid taxes . . . . . . . . . . . . . . . . . . . . . . . . . . . . . . . . . . . . . . . . . . 52,663 9,069 9,072
Excess tax benefit realized from exercise of stock options . . . . . . . . . . . (43,707) 12,308 5,082
Accounts payable and accrued liabilities . . . . . . . . . . . . . . . . . . . . . . . 197,306 148,054 17,872
Net cash flows provided by operating activities . . . . . . . . . . . . . . . . . . 423,504 291,418 145,987
Cash flows from investing activities:
Purchase of property and equipment . . . . . . . . . . . . . . . . . . . . . . . . . . . . . (133,930) (110,696) (98,305)
Merger with Electronics Boutique, net of cash acquired . . . . . . . . . . . . . . . . — (886,116) —
Acquisitions, net of cash acquired (including purchase of Game Brands
Inc.) . . . . . . . . . . . . . . . . . . . . . . . . . . . . . . . . . . . . . . . . . . . . . . . . . . (11,303) — (62)
Sale of assets held for sale . . . . . . . . . . . . . . . . . . . . . . . . . . . . . . . . . . . . 19,297 — —
Net cash flows used in investing activities . . . . . . . . . . . . . . . . . . . . . . . . . (125,936) (996,812) (98,367)
Cash flows from financing activities:
Issuance of senior notes payable relating to Electronics Boutique merger, net
of discount . . . . . . . . . . . . . . . . . . . . . . . . . . . . . . . . . . . . . . . . . . . . . — 641,472 —
Issuance of senior floating rate notes payable relating to Electronics Boutique
merger . . . . . . . . . . . . . . . . . . . . . . . . . . . . . . . . . . . . . . . . . . . . . . . . — 300,000 —
Repurchase of notes payable . . . . . . . . . . . . . . . . . . . . . . . . . . . . . . . . . . . (100,000) — —
Purchase of treasury shares through repurchase program. . . . . . . . . . . . . . . . — — (14,994)
Repurchase of common stock from Barnes & Noble . . . . . . . . . . . . . . . . . . — — (111,781)
Issuance of debt relating to the repurchase of common stock from Barnes &
Noble . . . . . . . . . . . . . . . . . . . . . . . . . . . . . . . . . . . . . . . . . . . . . . . . . — — 74,020
Repayment of debt relating to the repurchase of common stock from
Barnes & Noble . . . . . . . . . . . . . . . . . . . . . . . . . . . . . . . . . . . . . . . . . . (12,173) (12,173) (37,500)
Repayment of other debt . . . . . . . . . . . . . . . . . . . . . . . . . . . . . . . . . . . . . (9,441) (956) —
Proceeds from exercise of stock options . . . . . . . . . . . . . . . . . . . . . . . . . . . 33,861 20,800 9,474
Excess tax benefit realized from exercise of stock options . . . . . . . . . . . . . . 43,707 — —
Net increase in other noncurrent assets and deferred financing fees . . . . . . . . (2,609) (13,466) (825)
Net cash flows provided by (used in) financing activities . . . . . . . . . . . . . . . (46,655) 935,677 (81,606)
Exchange rate effect on cash and cash equivalents . . . . . . . . . . . . . . . . . . . . (103) 318 73
Net increase (decrease) in cash and cash equivalents . . . . . . . . . . . . . . . . . . 250,810 230,601 (33,913)
Cash and cash equivalents at beginning of period . . . . . . . . . . . . . . . . . . . . . . 401,593 170,992 204,905
Cash and cash equivalents at end of period . . . . . . . . . . . . . . . . . . . . . . . . . . $ 652,403 $ 401,593 $ 170,992
See accompanying notes to consolidated financial statements.
F-6