GameStop 2006 Annual Report Download - page 80
Download and view the complete annual report
Please find page 80 of the 2006 GameStop annual report below. You can navigate through the pages in the report by either clicking on the pages listed below, or by using the keyword search tool below to find specific information within the annual report.-
 1
1 -
2
-
3
-
4
-
5
-
6
-
7
-
8
-
9
-
10
-
11
-
12
-
13
-
14
-
15
-
16
-
17
-
18
-
19
-
20
-
21
-
22
-
23
-
24
-
25
-
26
-
27
-
28
-
29
-
30
-
31
-
32
-
33
-
34
-
35
-
36
-
37
-
38
-
39
-
40
-
41
-
42
-
43
-
44
-
45
-
46
-
47
-
48
-
49
-
50
-
51
-
52
-
53
-
54
-
55
-
56
-
57
-
58
-
59
-
60
-
61
-
62
-
63
-
64
-
65
-
66
-
67
-
68
-
69
-
 70
70 -
 71
71 -
 72
72 -
 73
73 -
 74
74 -
 75
75 -
 76
76 -
 77
77 -
 78
78 -
 79
79 -
 80
80 -
 81
81 -
 82
82 -
 83
83 -
 84
84 -
 85
85 -
 86
86 -
 87
87 -
 88
88 -
 89
89 -
 90
90 -
91
-
92
-
93
-
94
-
95
-
96
-
97
-
98
-
99
-
100
-
101
-
102
-
103
-
104
-
105
-
106
-
107
-
108
-
109
-
110
-
111
-
112
-
113
-
114
-
115
-
116
 |
 |

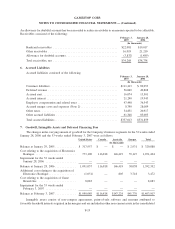
Company adopted the provisions of SFAS 123(R) using the modified prospective application method, and
accordingly, we have not restated the consolidated results of income from prior interim periods and fiscal years.
Under SFAS 123(R), the Company records stock-based compensation expense based on the grant-date fair
value estimated in accordance with the original provisions of Statement of Financial Accounting Standards No. 123,
Accounting for Stock-Based Compensation, and previously presented in the pro forma footnote disclosures, for all
options granted prior to, but not vested as of, the adoption date. In addition, the Company records compensation
expense for the share-based awards issued after the adoption date in accordance with SFAS 123(R).
In addition to requiring companies to recognize the estimated fair value of share-based payments in earnings,
SFAS 123(R) modified the presentation of tax benefits received in excess of amounts determined based on the
compensation expense recognized. Previously, such amounts were considered sources of cash in the operating
activities section of the Statement of Cash Flows. For periods after adopting SFAS 123(R) under the modified
prospective method, such benefits are presented as a use of cash in the operating section and a source of cash in the
financing section of the Statement of Cash Flows. Note 13 provides additional information regarding the
Company’s stock option plan.
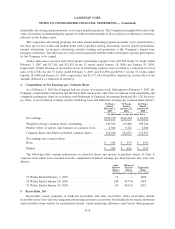
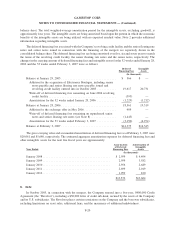
The following table illustrates the effect on net earnings and net earnings per common share if the Company
had applied the fair value recognition provisions of SFAS 123 to stock-based employee compensation for the
options granted under its plans:
52 Weeks
Ended
January 28,
2006
52 Weeks
Ended
January 29,
2005
(In thousands, except per
share data)
Net earnings, as reported...................................... $100,784 $60,926
Deduct: Total stock-based employee compensation expense determined
under fair value based method for all awards, net of related tax effects . . 6,666 9,405
Pro forma net earnings ....................................... $ 94,118 $51,521
Net earnings per common share — basic, as reported ................. $ 0.87 $ 0.56
Net earnings per common share — basic, pro forma .................. $ 0.81 $ 0.47
Net earnings per common share — diluted, as reported ............... $ 0.81 $ 0.53
Net earnings per common share — diluted, pro forma ................ $ 0.75 $ 0.45
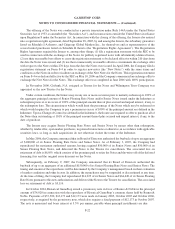
The fair value of each option grant is estimated on the date of grant using the Black-Scholes option pricing
model. This valuation model requires the use of subjective assumptions, including expected option life and
expected volatility. The Company uses historical data to estimate the option life and the employee forfeiture rate,
and uses historical volatility when estimating the stock price volatility. The weighted-average fair values of the
options granted during the 53 weeks ended February 3, 2007 and the 52 weeks ended January 28, 2006 and
January 29, 2005 were estimated at $8.42, $4.42 and $3.93, respectively, using the following assumptions:
53 Weeks
Ended
February 3,
2007
52 Weeks
Ended
January 28,
2006
52 Weeks
Ended
January 29,
2005
Volatility ....................................... 54.5% 57.3% 60.1%
Risk-free interest rate .............................. 4.6% 4.2% 3.3%
Expected life (years)............................... 3.0 6.0 6.0
Expected dividend yield ............................ 0% 0% 0%
F-12
GAMESTOP CORP.
NOTES TO CONSOLIDATED FINANCIAL STATEMENTS — (Continued)