GameStop 2006 Annual Report Download - page 40
Download and view the complete annual report
Please find page 40 of the 2006 GameStop annual report below. You can navigate through the pages in the report by either clicking on the pages listed below, or by using the keyword search tool below to find specific information within the annual report.-
 1
1 -
2
-
3
-
4
-
5
-
6
-
7
-
8
-
9
-
10
-
11
-
12
-
13
-
14
-
15
-
16
-
17
-
18
-
19
-
20
-
21
-
22
-
23
-
24
-
25
-
26
-
27
-
28
-
29
-
 30
30 -
 31
31 -
 32
32 -
 33
33 -
 34
34 -
 35
35 -
 36
36 -
 37
37 -
 38
38 -
 39
39 -
 40
40 -
 41
41 -
 42
42 -
 43
43 -
 44
44 -
 45
45 -
 46
46 -
 47
47 -
 48
48 -
 49
49 -
 50
50 -
51
-
52
-
53
-
54
-
55
-
56
-
57
-
58
-
59
-
60
-
61
-
62
-
63
-
64
-
65
-
66
-
67
-
68
-
69
-
70
-
71
-
72
-
73
-
74
-
75
-
76
-
77
-
78
-
79
-
80
-
81
-
82
-
83
-
84
-
85
-
86
-
87
-
88
-
89
-
90
-
91
-
92
-
93
-
94
-
95
-
96
-
97
-
98
-
99
-
100
-
101
-
102
-
103
-
104
-
105
-
106
-
107
-
108
-
109
-
110
-
111
-
112
-
113
-
114
-
115
-
116
 |
 |

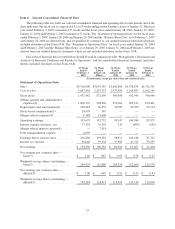
Item 6. Selected Consolidated Financial Data
The following table sets forth our selected consolidated financial and operating data for the periods and at the
dates indicated. Our fiscal year is composed of 52 or 53 weeks ending on the Saturday closest to January 31. The fiscal
year ended February 3, 2007 consisted of 53 weeks and the fiscal years ended January 28, 2006, January 29, 2005,
January 31, 2004 and February 1, 2003 consisted of 52 weeks. The “Statement of Operations Data” for the fiscal years
ended February 3, 2007, January 28, 2006 and January 29, 2005 and the “Balance Sheet Data” as of February 3, 2007
and January 28, 2006 are derived from, and are qualified by reference to, our audited financial statements which are
included elsewhere in this Form 10-K. The “Statement of Operations Data” for fiscal years ended January 31, 2004
and February 1, 2003 and the “Balance Sheet Data” as of January 29, 2005, January 31, 2004 and February 1, 2003 are
derived from our audited financial statements which are not included elsewhere in this Form 10-K.
Our selected financial data set forth below should be read in conjunction with “Management’s Discussion and
Analysis of Financial Condition and Results of Operations” and the consolidated financial statements and notes
thereto included elsewhere in this Form 10-K.
53 Weeks
Ended
February 3,
2007
52 Weeks
Ended
January 28,
2006(1)
52 Weeks
Ended
January 29,
2005
52 Weeks
Ended
January 31,
2004
52 Weeks
Ended
February 1,
2003
(In thousands, except per share data and statistical data)
Statement of Operations Data:
Sales ............................. $5,318,900 $3,091,783 $1,842,806 $1,578,838 $1,352,791
Cost of sales ....................... 3,847,458 2,219,753 1,333,506 1,145,893 1,012,145
Gross profit ........................ 1,471,442 872,030 509,300 432,945 340,646
Selling, general and administrative
expenses(2) ...................... 1,000,135 598,996 373,364 299,193 230,461
Depreciation and amortization(2) ........ 109,862 66,355 36,789 29,368 23,114
Stock-based compensation(3) ........... 20,978 347 — — —
Merger-related expenses(4) ............. 6,788 13,600 — — —
Operating earnings ................... 333,679 192,732 99,147 104,384 87,071
Interest expense (income), net........... 73,324 25,292 236 (804) (630)
Merger-related interest expense(4) ....... — 7,518 — — —
Debt extinguishment expense ........... 6,059 ————
Earnings before income taxes ........... 254,296 159,922 98,911 105,188 87,701
Income tax expense .................. 96,046 59,138 37,985 41,721 35,297
Net earnings ....................... $ 158,250 $ 100,784 $ 60,926 $ 63,467 $ 52,404
Net earnings per common share —
basic(5) ......................... $ 1.06 $ 0.87 $ 0.56 $ 0.56 $ 0.47
Weighted average shares outstanding —
basic(5) ......................... 149,924 115,840 109,324 112,660 112,578
Net earnings per common share —
diluted(5) ........................ $ 1.00 $ 0.81 $ 0.53 $ 0.53 $ 0.43
Weighted average shares outstanding —
diluted(5) ........................ 158,284 124,972 115,592 119,528 120,838
25