GameStop 2006 Annual Report Download - page 49
Download and view the complete annual report
Please find page 49 of the 2006 GameStop annual report below. You can navigate through the pages in the report by either clicking on the pages listed below, or by using the keyword search tool below to find specific information within the annual report.-
 1
1 -
2
-
3
-
4
-
5
-
6
-
7
-
8
-
9
-
10
-
11
-
12
-
13
-
14
-
15
-
16
-
17
-
18
-
19
-
20
-
21
-
22
-
23
-
24
-
25
-
26
-
27
-
28
-
29
-
30
-
31
-
32
-
33
-
34
-
35
-
36
-
37
-
38
-
 39
39 -
 40
40 -
 41
41 -
 42
42 -
 43
43 -
 44
44 -
 45
45 -
 46
46 -
 47
47 -
 48
48 -
 49
49 -
 50
50 -
 51
51 -
 52
52 -
 53
53 -
 54
54 -
 55
55 -
 56
56 -
 57
57 -
 58
58 -
 59
59 -
60
-
61
-
62
-
63
-
64
-
65
-
66
-
67
-
68
-
69
-
70
-
71
-
72
-
73
-
74
-
75
-
76
-
77
-
78
-
79
-
80
-
81
-
82
-
83
-
84
-
85
-
86
-
87
-
88
-
89
-
90
-
91
-
92
-
93
-
94
-
95
-
96
-
97
-
98
-
99
-
100
-
101
-
102
-
103
-
104
-
105
-
106
-
107
-
108
-
109
-
110
-
111
-
112
-
113
-
114
-
115
-
116
 |
 |

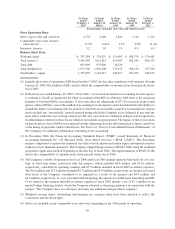
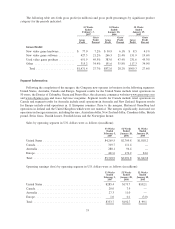
Total assets by operating segment in U.S. dollars were as follows (in millions):
February 3,
2007
January 28,
2006
January 29,
2005
United States .................................... $2,618.9 $2,347.8 $897.1
Canada......................................... 210.4 210.4 —
Australia ....................................... 210.7 214.7 —
Europe ......................................... 309.6 242.9 18.9
Total .......................................... $3,349.6 $3,015.8 $916.0
The Canada and Australia segments have a longer history of operations than the Europe segment and their
older store base generates more operating earnings than Europe. As stores in Europe mature, the Company expects
operating profit to increase. The segment results for the 52 weeks ended January 28, 2006 only include operations
from Canada, Australia and most of Europe from October 8, 2005 through January 28, 2006 due to the mergers.
Prior to the mergers, the Company’s international operations only included Ireland and the United Kingdom.
Having segment results for fiscal 2006 from Canada, Australia and Europe increased international segment sales
and operating earnings as a percentage of total sales and operating earnings from 12.4% and 9.9%, respectively, in
fiscal 2005 to 19.7% and 14.5%, respectively, in fiscal 2006. Management does not believe that a further
comparison of the international segment results for the 53 weeks ended February 3, 2007 would be meaningful.
The notes issued in connection with the mergers are reflected in the U.S. segment. See Note 21 of the
consolidated financial statements for more information.
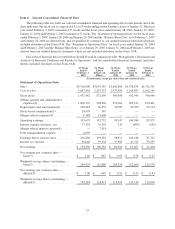
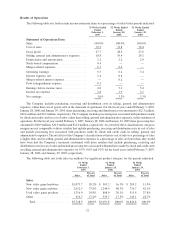
Fiscal 2006 Compared to Fiscal 2005
Sales increased by $2,227.1 million, or 72.0%, to $5,318.9 million in the 53 weeks of fiscal 2006 compared to
$3,091.8 million in the 52 weeks of fiscal 2005. Sales for the 53rd week included in fiscal 2006 were $99.1 million.
The remaining increase in sales was attributable to approximately $1,408.4 million of sales in EB stores in fiscal
2006 prior to the anniversary of the mergers, approximately $247.1 million in non-comparable store sales resulting
from the approximately 800 new GameStop stores opened since January 29, 2005, with the remaining increase of
$472.5 million due primarily to an increase in comparable store sales. The comparable store sales increase was
11.9% on a pro forma basis for fiscal 2006 when compared to fiscal 2005 and was expected due to the launch of the
Sony PlayStation 3 and Nintendo Wii in November 2006. Stores are included in our comparable store sales base
beginning in the thirteenth month of operation. The pro forma comparable store sales increase of 11.9% was
calculated by using the first 52 weeks of fiscal 2006 compared to the 52 weeks in fiscal 2005.
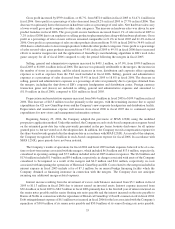
New video game hardware sales increased $570.5 million or 113.4%, from fiscal 2005 to fiscal 2006, primarily
due to the mergers, the 53rd week of sales included in fiscal 2006 and the launches of Microsoft Xbox 360 in
November 2005 and Playstation 3 and Nintendo Wii in November 2006. New hardware sales increased as a
percentage of sales from 16.3% in fiscal 2005 to 20.2% in fiscal 2006 due primarily to the first full year since the
Microsoft Xbox 360 launch and due to the launches of the new platforms in 2006. New video game software sales
also increased $767.6 million, or 61.7%, from fiscal 2005 to fiscal 2006, primarily due to the mergers, the 53rd week
of sales in fiscal 2006 and a strong lineup of new video game titles. New software sales as a percentage of total sales
decreased from 40.3% in fiscal 2005 to 37.8% in fiscal 2006 due to the increase in new hardware sales as a
percentage of total sales. Used video game product sales also grew due to the mergers, the 53rd week of sales in
fiscal 2006 and the increase in store count, with an increase in sales of $508.0 million, or 62.9%, from fiscal 2005.
Sales of other product categories, including PC entertainment and other software and accessories, magazines and
trading cards, grew 71.1%, or $381.0 million, from fiscal 2005 to fiscal 2006, primarily due to the mergers and the
53rd week of sales in fiscal 2006.
Cost of sales increased by $1,627.7 million, or 73.3%, from $2,219.8 million in fiscal 2005 to $3,847.5 million
in fiscal 2006 as a result of the mergers, the 53rd week of sales in fiscal 2006 and the changes in gross profit
discussed below.
34