GameStop 2006 Annual Report Download - page 48
Download and view the complete annual report
Please find page 48 of the 2006 GameStop annual report below. You can navigate through the pages in the report by either clicking on the pages listed below, or by using the keyword search tool below to find specific information within the annual report.-
 1
1 -
2
-
3
-
4
-
5
-
6
-
7
-
8
-
9
-
10
-
11
-
12
-
13
-
14
-
15
-
16
-
17
-
18
-
19
-
20
-
21
-
22
-
23
-
24
-
25
-
26
-
27
-
28
-
29
-
30
-
31
-
32
-
33
-
34
-
35
-
36
-
37
-
 38
38 -
 39
39 -
 40
40 -
 41
41 -
 42
42 -
 43
43 -
 44
44 -
 45
45 -
 46
46 -
 47
47 -
 48
48 -
 49
49 -
 50
50 -
 51
51 -
 52
52 -
 53
53 -
 54
54 -
 55
55 -
 56
56 -
 57
57 -
 58
58 -
59
-
60
-
61
-
62
-
63
-
64
-
65
-
66
-
67
-
68
-
69
-
70
-
71
-
72
-
73
-
74
-
75
-
76
-
77
-
78
-
79
-
80
-
81
-
82
-
83
-
84
-
85
-
86
-
87
-
88
-
89
-
90
-
91
-
92
-
93
-
94
-
95
-
96
-
97
-
98
-
99
-
100
-
101
-
102
-
103
-
104
-
105
-
106
-
107
-
108
-
109
-
110
-
111
-
112
-
113
-
114
-
115
-
116
 |
 |

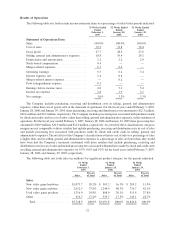
The following table sets forth gross profit (in millions) and gross profit percentages by significant product
category for the periods indicated:
Gross
Profit
Gross
Profit
Percent
Gross
Profit
Gross
Profit
Percent
Gross
Profit
Gross
Profit
Percent
53 Weeks
Ended
February 3,
2007
52 Weeks
Ended
January 28,
2006
52 Weeks
Ended
January 29,
2005
Gross Profit:
New video game hardware.......... $ 77.0 7.2% $ 30.9 6.1% $ 8.5 4.1%
New video game software .......... 427.3 21.2% 266.5 21.4% 151.9 19.6%
Used video game products .......... 651.9 49.5% 383.0 47.4% 231.6 45.3%
Other ......................... 315.2 34.4% 191.6 35.8% 117.3 34.0%
Total ........................ $1,471.4 27.7% $872.0 28.2% $509.3 27.6%
Segment Information
Following the completion of the mergers, the Company now operates its business in the following segments:
United States, Australia, Canada and Europe. Segment results for the United States include retail operations in
50 states, the District of Columbia, Guam and Puerto Rico, the electronic commerce websites www.gamestop.com
and www.ebgames.com and Game Informer magazine. Segment results for Canada include retail operations in
Canada and segment results for Australia include retail operations in Australia and New Zealand. Segment results
for Europe include retail operations in 11 European countries. Prior to the mergers, Historical GameStop had
operations in Ireland and the United Kingdom which were not material. The mergers significantly increased our
operations in foreign currencies, including the euro, Australian dollar, New Zealand dollar, Canadian dollar, British
pound, Swiss franc, Danish kroner, Swedish krona and the Norwegian kroner.
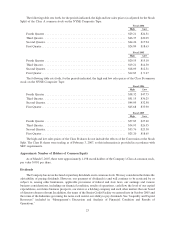
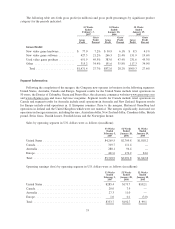
Sales by operating segment in U.S. dollars were as follows (in millions):
53 Weeks
Ended
February 3,
2007
52 Weeks
Ended
January 28,
2006
52 Weeks
Ended
January 29,
2005
United States .................................... $4,269.5 $2,709.8 $1,818.2
Canada......................................... 319.7 111.4 —
Australia ....................................... 288.1 94.4 —
Europe ......................................... 441.6 176.2 24.6
Total .......................................... $5,318.9 $3,091.8 $1,842.8
Operating earnings (loss) by operating segment in U.S. dollars were as follows (in millions):
53 Weeks
Ended
February 3,
2007
52 Weeks
Ended
January 28,
2006
52 Weeks
Ended
January 29,
2005
United States .................................... $285.4 $173.7 $102.1
Canada......................................... 20.0 7.9 —
Australia ....................................... 27.3 11.0 —
Europe ......................................... 1.0 0.1 (3.0)
Total .......................................... $333.7 $192.7 $ 99.1
33