Frontier Communications 2012 Annual Report Download - page 97
Download and view the complete annual report
Please find page 97 of the 2012 Frontier Communications annual report below. You can navigate through the pages in the report by either clicking on the pages listed below, or by using the keyword search tool below to find specific information within the annual report.-
 1
1 -
2
-
3
-
4
-
5
-
6
-
7
-
8
-
9
-
10
-
11
-
12
-
13
-
14
-
15
-
16
-
17
-
18
-
19
-
20
-
21
-
22
-
23
-
24
-
25
-
26
-
27
-
28
-
29
-
30
-
31
-
32
-
33
-
34
-
35
-
36
-
37
-
38
-
39
-
40
-
41
-
42
-
43
-
44
-
45
-
46
-
47
-
48
-
49
-
50
-
51
-
52
-
53
-
54
-
55
-
56
-
57
-
58
-
59
-
60
-
61
-
62
-
63
-
64
-
65
-
66
-
67
-
68
-
69
-
70
-
71
-
72
-
73
-
74
-
75
-
76
-
77
-
78
-
79
-
80
-
81
-
82
-
83
-
84
-
85
-
86
-
 87
87 -
 88
88 -
 89
89 -
 90
90 -
 91
91 -
 92
92 -
 93
93 -
 94
94 -
 95
95 -
 96
96 -
 97
97 -
 98
98 -
 99
99 -
 100
100 -
 101
101 -
 102
102 -
 103
103 -
 104
104 -
 105
105 -
 106
106
 |
 |

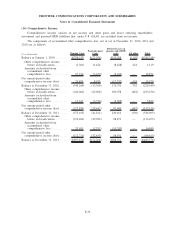
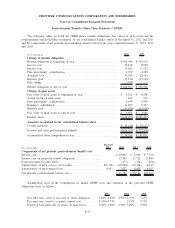
The OPEB plan’s expected benefit payments over the next 10 years are as follows:
($ in thousands)
Year
Gross
Benefits
Medicare Part D
Subsidy Total
2013 $ 14,010 $ 430 $ 13,580
2014 15,591 533 15,058
2015 17,448 644 16,804
2016 19,457 760 18,697
2017 21,347 924 20,423
2018-2022 131,410 7,838 123,572
Total $219,263 $11,129 $208,134
For purposes of measuring year-end benefit obligations, we used, depending on medical plan coverage for
different retiree groups, an 8.0% annual rate of increase in the per-capita cost of covered medical benefits,
gradually decreasing to 5% in the year 2019 and remaining at that level thereafter. The effect of a 1% increase
in the assumed medical cost trend rates for each future year on the aggregate of the service and interest cost
components of the total postretirement benefit cost would be $1.3 million and the effect on the accumulated
postretirement benefit obligation for health benefits would be $19.8 million. The effect of a 1% decrease in the
assumed medical cost trend rates for each future year on the aggregate of the service and interest cost
components of the total postretirement benefit cost would be $(1.0) million and the effect on the accumulated
postretirement benefit obligation for health benefits would be $(16.1) million.
In December 2003, the Medicare Prescription Drug Improvement and Modernization Act of 2003 (the Act)
became law. The Act introduced a prescription drug benefit under Medicare. It includes a federal subsidy to
sponsors of retiree health care benefit plans that provide a benefit that is at least actuarially equivalent to the
Medicare Part D benefit. The amount of the federal subsidy is based on 28% of an individual beneficiary’s
annual eligible prescription drug costs ranging between $250 and $5,000. We have determined that the
Company-sponsored postretirement healthcare plans that provide prescription drug benefits are actuarially
equivalent to the Medicare Prescription Drug benefit. The impact of the federal subsidy has been incorporated
into the calculation.
The amounts in accumulated other comprehensive loss that have not yet been recognized as components of
net periodic benefit cost at December 31, 2012 and 2011 are as follows:
($ in thousands) 2012 2011 2012 2011
Pension Plan OPEB
Net actuarial loss ................................. $697,511 $574,998 $105,970 $ 82,841
Prior service cost/(credit) . . ........................ 363 165 (31,706) (41,030)
Total . .......................................... $697,874 $575,163 $ 74,264 $ 41,811
The amounts recognized as a component of accumulated comprehensive loss for the years ended
December 31, 2012 and 2011 are as follows:
($ in thousands) 2012 2011 2012 2011
Pension Plan OPEB
Accumulated other comprehensive loss at beginning
of year ........................................... $575,163 $349,264 $41,811 $13,369
Net actuarial gain (loss) recognized during year ...... (29,890) (15,364) (7,537) (4,424)
Prior service (cost)/credit recognized during year ..... 199 199 10,068 10,198
Net actuarial loss (gain) occurring during year........ 152,402 241,064 30,665 22,668
Prior service cost (credit) occurring during year ...... — — (743) —
Net amount recognized in comprehensive income for
the year .......................................... 122,711 225,899 32,453 28,442
Accumulated other comprehensive loss at end of year. $697,874 $575,163 $74,264 $41,811
F-36
FRONTIER COMMUNICATIONS CORPORATION AND SUBSIDIARIES
Notes to Consolidated Financial Statements