Frontier Communications 2012 Annual Report Download - page 9
Download and view the complete annual report
Please find page 9 of the 2012 Frontier Communications annual report below. You can navigate through the pages in the report by either clicking on the pages listed below, or by using the keyword search tool below to find specific information within the annual report.-
 1
1 -
 2
2 -
 3
3 -
 4
4 -
 5
5 -
 6
6 -
 7
7 -
 8
8 -
 9
9 -
 10
10 -
 11
11 -
 12
12 -
 13
13 -
 14
14 -
 15
15 -
 16
16 -
 17
17 -
 18
18 -
 19
19 -
 20
20 -
21
-
22
-
23
-
24
-
25
-
26
-
27
-
28
-
29
-
30
-
31
-
32
-
33
-
34
-
35
-
36
-
37
-
38
-
39
-
40
-
41
-
42
-
43
-
44
-
45
-
46
-
47
-
48
-
49
-
50
-
51
-
52
-
53
-
54
-
55
-
56
-
57
-
58
-
59
-
60
-
61
-
62
-
63
-
64
-
65
-
66
-
67
-
68
-
69
-
70
-
71
-
72
-
73
-
74
-
75
-
76
-
77
-
78
-
79
-
80
-
81
-
82
-
83
-
84
-
85
-
86
-
87
-
88
-
89
-
90
-
91
-
92
-
93
-
94
-
95
-
96
-
97
-
98
-
99
-
100
-
101
-
102
-
103
-
104
-
105
-
106
 |
 |

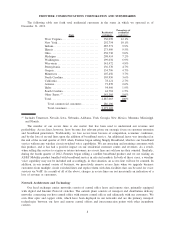
The following table sets forth total residential customers in the states in which we operated as of
December 31, 2012.
State
Residential
customers
Percentage of
residential
customers
West Virginia............................. 350,070 12.1%
New York ................................ 292,754 10.1%
Indiana . .................................. 285,571 9.9%
Illinois . .................................. 273,409 9.5%
Ohio . . . .................................. 258,730 9.0%
Michigan ................................. 208,414 7.2%
Washington ............................... 199,034 6.9%
Wisconsin ................................ 141,472 4.9%
Pennsylvania.............................. 136,370 4.7%
Oregon . .................................. 134,796 4.7%
Minnesota ................................ 107,456 3.7%
North Carolina . . . ......................... 103,950 3.6%
California................................. 78,121 2.7%
Arizona. .................................. 73,870 2.6%
Idaho. . . .................................. 54,960 1.9%
South Carolina . . . ......................... 44,781 1.5%
Other States (1) ............................ 143,305 5.0%
Total . . . .................................. 2,887,063 100%
Total commercial customers ............. 286,106
Total customers......................... 3,173,169
(1) Includes Tennessee, Nevada, Iowa, Nebraska, Alabama, Utah, Georgia, New Mexico, Montana, Mississippi
and Florida.
The number of our access lines is one metric that has been used to understand our revenue and
profitability. Access lines, however, have become less relevant given our strategic focus on customer retention
and broadband penetration. Traditionally, we lose access lines because of competition, economic conditions,
and by the loss of second lines upon the addition of broadband service. An additional factor was introduced at
the end of the second quarter of 2012 when, Frontier began selling Simply Broadband, which is our broadband
service without any wireline circuit switched voice capabilities. We are attracting and retaining customers with
this product, and it has had a positive impact on our residential customer counts and revenues. As a result,
when selling this service to acquire or retain customers, no access lines are sold nor are they counted. Similarly,
during the fourth quarter of 2012, Frontier began selling a satellite broadband product and we are trialing an
AT&T Mobility product bundled with broadband service in selected markets. In both of these cases, a wireline
voice capability may not be included and accordingly, in that situation, an access line will not be counted. In
addition, in our normal course of business, we proactively remove access lines when we upgrade business
customers from multiple circuit switched lines and replace them with data facilities that can be used for voice
services via VoIP. As a result of all of the above, changes in access lines are not necessarily an indication of a
loss of revenue or customers.
Network Architecture and Technology
Our local exchange carrier networks consist of central office hosts and remote sites, primarily equipped
with digital and Internet Protocol switches. The outside plant consists of transport and distribution delivery
networks connecting our host central office with remote central offices and ultimately with our customers. We
own fiber optic and copper cable, which have been deployed in our networks and are the primary transport
technologies between our host and remote central offices and interconnection points with other incumbent
carriers.
8
FRONTIER COMMUNICATIONS CORPORATION AND SUBSIDIARIES