Frontier Communications 2012 Annual Report Download - page 53
Download and view the complete annual report
Please find page 53 of the 2012 Frontier Communications annual report below. You can navigate through the pages in the report by either clicking on the pages listed below, or by using the keyword search tool below to find specific information within the annual report.-
 1
1 -
2
-
3
-
4
-
5
-
6
-
7
-
8
-
9
-
10
-
11
-
12
-
13
-
14
-
15
-
16
-
17
-
18
-
19
-
20
-
21
-
22
-
23
-
24
-
25
-
26
-
27
-
28
-
29
-
30
-
31
-
32
-
33
-
34
-
35
-
36
-
37
-
38
-
39
-
40
-
41
-
42
-
 43
43 -
 44
44 -
 45
45 -
 46
46 -
 47
47 -
 48
48 -
 49
49 -
 50
50 -
 51
51 -
 52
52 -
 53
53 -
 54
54 -
 55
55 -
 56
56 -
 57
57 -
 58
58 -
 59
59 -
 60
60 -
 61
61 -
 62
62 -
 63
63 -
64
-
65
-
66
-
67
-
68
-
69
-
70
-
71
-
72
-
73
-
74
-
75
-
76
-
77
-
78
-
79
-
80
-
81
-
82
-
83
-
84
-
85
-
86
-
87
-
88
-
89
-
90
-
91
-
92
-
93
-
94
-
95
-
96
-
97
-
98
-
99
-
100
-
101
-
102
-
103
-
104
-
105
-
106
 |
 |
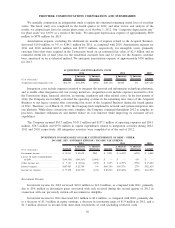
accounting method for repairs and maintenance costs related to tax years 2008 and prior. Absent any legislative
changes in 2013, we expect that our cash tax payments will be approximately $125 million to $150 million for
2013.
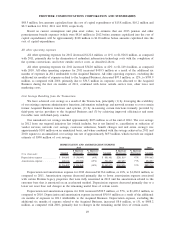
Net income attributable to common shareholders of Frontier
Net income attributable to common shareholders of Frontier for 2012 was $136.6 million, or $0.14 per
share, as compared to $149.6 million, or $0.15 per share, in 2011 and $152.7 million, or $0.23 per share, in
2010. The change in basic and diluted net income per share for 2011 and 2012, as compared to 2010, was
primarily due to the increase in weighted average shares outstanding as a result of the issuance of 678.5 million
shares in connection with our acquisition of the Acquired Business.
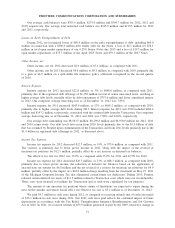
Item 7A. Quantitative and Qualitative Disclosures about Market Risk
We are exposed to market risk in the normal course of our business operations due to ongoing investing
and funding activities, including those associated with our pension assets. Market risk refers to the potential
change in fair value of a financial instrument as a result of fluctuations in interest rates and equity prices. We
do not hold or issue derivative instruments, derivative commodity instruments or other financial instruments for
trading purposes. As a result, we do not undertake any specific actions to cover our exposure to market risks,
and we are not party to any market risk management agreements other than in the normal course of business.
Our primary market risk exposures are interest rate risk and equity price risk as follows:
Interest Rate Exposure
Our exposure to market risk for changes in interest rates relates primarily to the interest-bearing portion of
our pension investment portfolio and related obligations, and floating rate indebtedness. Our long-term debt as
of December 31, 2012 was 94% fixed rate debt with minimal exposure to interest rate changes. We had no
interest rate swap agreements related to our fixed rate debt in effect at December 31, 2012 and 2011.
Our objectives in managing our interest rate risk are to limit the impact of interest rate changes on
earnings and cash flows and to lower our overall borrowing costs. To achieve these objectives, all but $517.5
million of our outstanding borrowings at December 31, 2012 have fixed interest rates. In addition, our undrawn
$750.0 million revolving credit facility has interest rates that float with LIBOR, as defined. Consequently, we
have limited material future earnings or cash flow exposures from changes in interest rates on our long-term
debt. An adverse change in interest rates would increase the amount that we pay on our variable rate
obligations and could result in fluctuations in the fair value of our fixed rate obligations. Based upon our
overall interest rate exposure at December 31, 2012, a near-term change in interest rates would not materially
affect our consolidated financial position, results of operations or cash flows.
Sensitivity analysis of interest rate exposure
At December 31, 2012, the fair value of our long-term debt was estimated to be approximately $9.1
billion, based on our overall weighted average borrowing rate of 7.85% and our overall weighted average
maturity of approximately 9 years. As of December 31, 2012, there has been no material change in the
weighted average maturity applicable to our obligations since December 31, 2011.
Equity Price Exposure
Our exposure to market risks for changes in equity security prices as of December 31, 2012 is limited to
our pension assets. We have no other security investments of any material amount.
The Company’s pension plan assets have decreased from $1,258.0 million at December 31, 2011 to
$1,253.6 million at December 31, 2012, a decrease of $4.4 million. This decrease is a result of benefit
payments of $172.6 million, primarily offset by $139.6 million of positive investment returns (including $13.0
million of additional asset transfers from Verizon) and $28.6 million of net cash contributions. We made total
net cash contributions to our pension plan for 2012 of $28.6 million, which reflects the positive impact of
52
FRONTIER COMMUNICATIONS CORPORATION AND SUBSIDIARIES