Frontier Communications 2012 Annual Report Download - page 39
Download and view the complete annual report
Please find page 39 of the 2012 Frontier Communications annual report below. You can navigate through the pages in the report by either clicking on the pages listed below, or by using the keyword search tool below to find specific information within the annual report.-
 1
1 -
2
-
3
-
4
-
5
-
6
-
7
-
8
-
9
-
10
-
11
-
12
-
13
-
14
-
15
-
16
-
17
-
18
-
19
-
20
-
21
-
22
-
23
-
24
-
25
-
26
-
27
-
28
-
 29
29 -
 30
30 -
 31
31 -
 32
32 -
 33
33 -
 34
34 -
 35
35 -
 36
36 -
 37
37 -
 38
38 -
 39
39 -
 40
40 -
 41
41 -
 42
42 -
 43
43 -
 44
44 -
 45
45 -
 46
46 -
 47
47 -
 48
48 -
 49
49 -
50
-
51
-
52
-
53
-
54
-
55
-
56
-
57
-
58
-
59
-
60
-
61
-
62
-
63
-
64
-
65
-
66
-
67
-
68
-
69
-
70
-
71
-
72
-
73
-
74
-
75
-
76
-
77
-
78
-
79
-
80
-
81
-
82
-
83
-
84
-
85
-
86
-
87
-
88
-
89
-
90
-
91
-
92
-
93
-
94
-
95
-
96
-
97
-
98
-
99
-
100
-
101
-
102
-
103
-
104
-
105
-
106
 |
 |

amount by which the carrying amount of the assets exceeds the estimated fair value. Also, we periodically
reassess the useful lives of our tangible and intangible assets to determine whether any changes are required. In
2012 and 2011, we had no “critical estimates” related to asset impairments.
Intangibles
Our indefinite lived intangibles consist of goodwill and trade name, which resulted from the purchase of
ILEC properties. We test for impairment of these assets annually, or more frequently, as circumstances warrant.
We test for goodwill impairment at the “operating segment” level, as that term is defined in U.S. GAAP.
Effective with the third quarter of 2011, the Company reorganized into six operating segments in order to
leverage the full benefits of its local engagement model. The six operating segments consist of the following
regions: Central, Midwest, National, Northeast, Southeast and West. Our operating segments are aggregated
into one reportable segment since they have similar economic characteristics. In conjunction with the
reorganization of our operating segments during the third quarter of 2011, we reassigned goodwill to our
reporting units using a relative fair value allocation approach. This structure is consistent with how our Chief
Operating Decision Makers (CEO, CFO, President and COO) review our results on a daily, weekly and
monthly basis. After making the change in our operating segments, we reviewed our goodwill impairment test
by comparing the EBITDA multiples for each reporting unit to their carrying values noting that no impairment
indicator was present. No potential impairment was indicated and no further analysis was deemed necessary.
Our annual goodwill impairment testing date is December 31. Each of the operating segments is also a
reporting unit. The first step in the goodwill impairment test compares the carrying value of net assets of the
reporting unit to its fair value. The result of this first step indicated that fair value of each reporting unit
exceeded the carrying value of such reporting units. As a result, the second step of the goodwill impairment test
was not required.
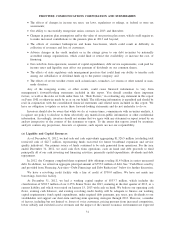
Goodwill by reporting unit (operating segment) at December 31, 2012 and 2011 is as follows:
($ in thousands) Northeast National Southeast West Central Midwest
Reporting Units
Goodwill ........ $1,245,414 $1,176,139 $1,113,931 $1,072,499 $1,006,132 $723,604
Enterprise values for rural ILEC properties are typically quoted as a multiple of cash flow or EBITDA.
Marketplace company comparisons and analyst reports support a range of values around a multiple of 5.5 to 7.5
times annualized EBITDA. For the purpose of the goodwill impairment test we define EBITDA as operating
income, net of acquisition and integration costs, non-cash pension/OPEB costs and severance costs, plus
depreciation and amortization. We determined the fair value estimates using 6.25 times EBITDA but also used
lower EBITDA multiples to gauge the sensitivity of the estimate and its effect on the margin of excess of fair
value over the carrying values of the reporting units. Total fair value determined in this manner is then
allocated to the reporting units based upon each unit’s relative share of consolidated EBITDA. Our method of
determining fair value has been consistently applied for the three years ending December 31, 2012.
The Company monitors relevant circumstances, including general economic conditions, enterprise value
EBITDA multiples for rural ILEC properties, the Company’s overall financial performance and the market
prices for the Company’s common stock, and the potential impact that changes in such circumstances might
have on the valuation of the Company’s goodwill or other intangible assets. If our goodwill or other intangible
assets are determined to be impaired in the future, we may be required to record a non-cash charge to earnings
during the period in which the impairment is determined.
Effective with the first quarter of 2013, the Company reorganized into four operating segments consisting
of the following regions: East, Central, National and West. Our operating segments are aggregated into one
reportable segment.
Depreciation and Amortization
The calculation of depreciation and amortization expense is based upon the estimated useful lives of the
underlying property, plant and equipment and identifiable intangible assets. Depreciation expense is principally
based on the composite group method for substantially all of our property, plant and equipment assets. Given
38
FRONTIER COMMUNICATIONS CORPORATION AND SUBSIDIARIES