Frontier Communications 2012 Annual Report Download - page 43
Download and view the complete annual report
Please find page 43 of the 2012 Frontier Communications annual report below. You can navigate through the pages in the report by either clicking on the pages listed below, or by using the keyword search tool below to find specific information within the annual report.-
 1
1 -
2
-
3
-
4
-
5
-
6
-
7
-
8
-
9
-
10
-
11
-
12
-
13
-
14
-
15
-
16
-
17
-
18
-
19
-
20
-
21
-
22
-
23
-
24
-
25
-
26
-
27
-
28
-
29
-
30
-
31
-
32
-
 33
33 -
 34
34 -
 35
35 -
 36
36 -
 37
37 -
 38
38 -
 39
39 -
 40
40 -
 41
41 -
 42
42 -
 43
43 -
 44
44 -
 45
45 -
 46
46 -
 47
47 -
 48
48 -
 49
49 -
 50
50 -
 51
51 -
 52
52 -
 53
53 -
54
-
55
-
56
-
57
-
58
-
59
-
60
-
61
-
62
-
63
-
64
-
65
-
66
-
67
-
68
-
69
-
70
-
71
-
72
-
73
-
74
-
75
-
76
-
77
-
78
-
79
-
80
-
81
-
82
-
83
-
84
-
85
-
86
-
87
-
88
-
89
-
90
-
91
-
92
-
93
-
94
-
95
-
96
-
97
-
98
-
99
-
100
-
101
-
102
-
103
-
104
-
105
-
106
 |
 |
adopted ASU 2013-02 during the fourth quarter of 2012 with no impact on our financial position, results of
operations or cash flows.
Indefinite-Lived Intangible Assets
In July 2012, the FASB issued ASU No. 2012-02 (ASU 2012-02), “Intangibles—Goodwill and Other—
Testing Indefinite-Lived Intangible Assets for Impairment,” (ASC Topic 350). ASU 2012-02 permits an entity
to first assess qualitative factors to determine whether it is more likely than not that an indefinite-lived
intangible asset is impaired as a basis for determining whether it is necessary to perform a quantitative
impairment test. The more-likely-than-not threshold is defined as having a likelihood of more than 50 percent.
This amendment also gives an entity the option not to calculate annually the fair value of an indefinite-lived
intangible asset if the entity can determine that it is not more likely than not that the asset is impaired. If an
entity concludes that it is not more likely than not that the indefinite-lived intangible asset is impaired, then the
entity is not required to take further action. While ASU 2012-02 is effective for annual and interim impairment
tests performed for fiscal years beginning after September 15, 2012, early adoption is permitted. The Company
adopted ASU 2012-02 during the fourth quarter of 2012 with no material impact on our financial position,
results of operations or cash flows.
(b) Results of Operations
Effective July 1, 2010, the Company’s scope of operations and balance sheet capitalization changed
materially as a result of the completion of the Transaction. Historical financial and operating data presented for
Frontier is not indicative of future results and includes the results of operations of the Acquired Business from
the date of acquisition on July 1, 2010. The financial discussion and tables below include a comparative
analysis of our results of operations on a historical basis for our Frontier operations as of and for the years
ended December 31, 2012, 2011 and 2010, which includes the results of operations of the Acquired Business
for the years ended December 31, 2012 and 2011, and the six months ended December 31, 2010. The variance
explanations discussed below for the years ended December 31, 2011 and 2010 include a separate amount for
the additional six months of revenue and operating expenses related to the operating results of the Acquired
Business in 2011. Certain analyses of revenue and operating expenses may refer to the results of the Frontier
legacy operations, which excludes the Acquired Business.
REVENUE
Revenue is generated primarily through the provision of local, network access, long distance, data, video
and Internet services. Such revenues are generated through either a monthly recurring fee or a fee based on
usage and revenue recognition is not dependent upon significant judgments by management, with the exception
of a determination of a provision for uncollectible amounts.
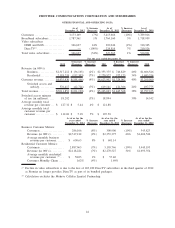
Revenue for 2012 decreased $231.2 million, or 4%, to $5,011.9 million as compared to 2011. This decline
in 2012 is primarily the result of decreases in the number of business and residential customers and switched
access revenue, partially offset by an increase in subsidies revenue, each as described in more detail below.
Switched access and subsidy revenue of $576.4 million represented 12% of our revenues for 2012.
Switched access revenue was $257.8 million for 2012, or 5% of our revenues, as compared to $319.0 million
for 2011, or 6% of our revenues. Subsidy revenue was $318.6 million in 2012, or 6% of our revenues, as
compared to $300.1 million in 2011, or 6% of our revenues. We expect switched access and subsidy revenue to
decline in 2013.
Revenue for 2011 increased $1,445.4 million, or 38%, to $5,243.0 million as compared to 2010. Excluding
the additional six months of revenue of $1,667.1 million attributable to the Acquired Business, our revenue for
2011 decreased $221.7 million, or 6%, as compared to 2010. This decline in 2011 was a result of decreases in
the number of business and residential customers, switched access, video and other revenue, partially offset by
a $32.7 million, or 3%, increase in data and Internet services revenue, each as described in more detail below.
The number of our access lines is one metric that has been used to understand our revenue and
profitability. Access lines, however, have become less relevant given our strategic focus on customer retention
42
FRONTIER COMMUNICATIONS CORPORATION AND SUBSIDIARIES