Frontier Communications 2012 Annual Report Download - page 51
Download and view the complete annual report
Please find page 51 of the 2012 Frontier Communications annual report below. You can navigate through the pages in the report by either clicking on the pages listed below, or by using the keyword search tool below to find specific information within the annual report.-
 1
1 -
2
-
3
-
4
-
5
-
6
-
7
-
8
-
9
-
10
-
11
-
12
-
13
-
14
-
15
-
16
-
17
-
18
-
19
-
20
-
21
-
22
-
23
-
24
-
25
-
26
-
27
-
28
-
29
-
30
-
31
-
32
-
33
-
34
-
35
-
36
-
37
-
38
-
39
-
40
-
 41
41 -
 42
42 -
 43
43 -
 44
44 -
 45
45 -
 46
46 -
 47
47 -
 48
48 -
 49
49 -
 50
50 -
 51
51 -
 52
52 -
 53
53 -
 54
54 -
 55
55 -
 56
56 -
 57
57 -
 58
58 -
 59
59 -
 60
60 -
 61
61 -
62
-
63
-
64
-
65
-
66
-
67
-
68
-
69
-
70
-
71
-
72
-
73
-
74
-
75
-
76
-
77
-
78
-
79
-
80
-
81
-
82
-
83
-
84
-
85
-
86
-
87
-
88
-
89
-
90
-
91
-
92
-
93
-
94
-
95
-
96
-
97
-
98
-
99
-
100
-
101
-
102
-
103
-
104
-
105
-
106
 |
 |

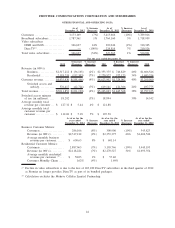
We annually commission an independent study to update the estimated remaining useful lives of our plant
assets. The latest study was completed in the fourth quarter of 2012, and after review and analysis of the
results, we adopted new lives for certain plant assets as of October 1, 2012. Our “composite depreciation rate”
for plant assets was 6.65% as a result of the study. We anticipate depreciation expense of approximately $850
million to $870 million for 2013.
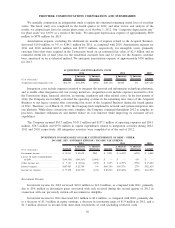
Amortization expense, excluding the additional six months of expense related to the Acquired Business,
decreased $10.0 million, or 3%, to $284.1 million for 2011, as compared with 2010. Amortization expense for
2011 and 2010 included $465.4 million and $237.8 million, respectively, for intangible assets (primarily
customer base) that were acquired in the Transaction based on an estimated fair value of $2.5 billion and an
estimated useful life of nine years for the residential customer base and 12 years for the business customer
base, amortized on an accelerated method. We anticipate amortization expense of approximately $330 million
for 2013.
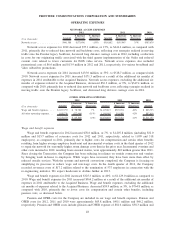
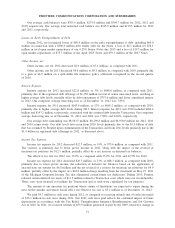
ACQUISITION AND INTEGRATION COSTS
($ in thousands) Amount
$ Increase
(Decrease)
% Increase
(Decrease) Amount
$ Increase
(Decrease)
% Increase
(Decrease) Amount
2012 2011 2010
Acquisition and integration costs . . . . . . $81,737 $(61,409) (43%) $143,146 $6,004 4% $137,142
Integration costs include expenses incurred to integrate the network and information technology platforms,
and to enable other integration and cost savings initiatives. Acquisition costs include expenses incurred to close
the Transaction (legal, financial advisory, accounting, regulatory and other related costs). In the first quarter of
2012, the Company successfully converted the operating systems in the remaining nine states of the Acquired
Business to our legacy systems after converting four states of the Acquired Business during the fourth quarter
of 2011. Therefore, as of March 31, 2012, the Company had completed its network and systems integration into
one platform. While these conversions were complete, the Company continued throughout 2012 to simplify its
processes, eliminate redundancies and further reduce its cost structure while improving its customer service
capabilities.
The Company incurred $81.7 million, $143.1 million and $137.1 million of operating expenses and $54.1
million, $76.5 million and $97.0 million in capital expenditures related to integration activities during 2012,
2011 and 2010, respectively. All integration activities were completed as of the end of 2012.
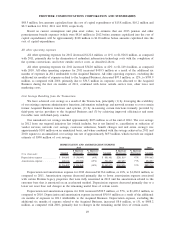
INVESTMENT INCOME/LOSSES ON EARLY EXTINGUISHMENT OF DEBT / OTHER
INCOME, NET / INTEREST EXPENSE / INCOME TAX EXPENSE
($ in thousands) Amount
$ Increase
(Decrease)
% Increase
(Decrease) Amount
$ Increase
(Decrease)
% Increase
(Decrease) Amount
2012 2011 2010
Investment income ................... $ 13,011 $ 10,620 NM $ 2,391 $ (4,457) (65%) $ 6,848
Losses on early extinguishment
of debt . . . . . . . . . ................... $(90,363) $(90,363) (100%) $ — $ — 0% $ —
Other income, net . ................... $ 7,121 $ (2,014) (22%) $ 9,135 $ (4,555) (33%) $ 13,690
Interest expense . . . ................... $687,985 $ 22,789 3% $665,196 $143,376 27% $521,820
Income tax expense . . . . . . . . . . . . . . . . . . $ 75,638 $(12,705) (14%) $ 88,343 $ (26,656) (23%) $114,999
Investment Income
Investment income for 2012 increased $10.6 million to $13.0 million, as compared with 2011, primarily
due to $9.8 million in investment gains associated with cash received during the second quarter of 2012 in
connection with our previously written-off investment in Adelphia.
Investment income for 2011 decreased $4.5 million to $2.4 million, as compared with 2010, primarily due
to a decrease of $1.3 million in equity earnings, a decrease in investment gains of $1.9 million in 2011, and a
$1.3 million decrease in income from short-term investments of cash (including restricted cash).
50
FRONTIER COMMUNICATIONS CORPORATION AND SUBSIDIARIES