Frontier Communications 2012 Annual Report Download - page 28
Download and view the complete annual report
Please find page 28 of the 2012 Frontier Communications annual report below. You can navigate through the pages in the report by either clicking on the pages listed below, or by using the keyword search tool below to find specific information within the annual report.-
 1
1 -
2
-
3
-
4
-
5
-
6
-
7
-
8
-
9
-
10
-
11
-
12
-
13
-
14
-
15
-
16
-
17
-
 18
18 -
 19
19 -
 20
20 -
 21
21 -
 22
22 -
 23
23 -
 24
24 -
 25
25 -
 26
26 -
 27
27 -
 28
28 -
 29
29 -
 30
30 -
 31
31 -
 32
32 -
 33
33 -
 34
34 -
 35
35 -
 36
36 -
 37
37 -
 38
38 -
39
-
40
-
41
-
42
-
43
-
44
-
45
-
46
-
47
-
48
-
49
-
50
-
51
-
52
-
53
-
54
-
55
-
56
-
57
-
58
-
59
-
60
-
61
-
62
-
63
-
64
-
65
-
66
-
67
-
68
-
69
-
70
-
71
-
72
-
73
-
74
-
75
-
76
-
77
-
78
-
79
-
80
-
81
-
82
-
83
-
84
-
85
-
86
-
87
-
88
-
89
-
90
-
91
-
92
-
93
-
94
-
95
-
96
-
97
-
98
-
99
-
100
-
101
-
102
-
103
-
104
-
105
-
106
 |
 |
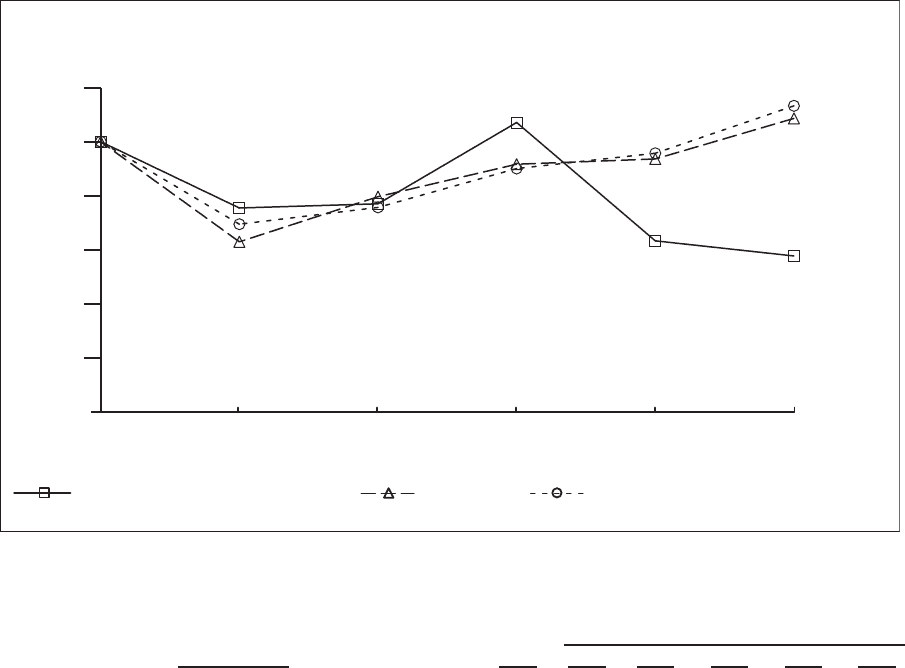
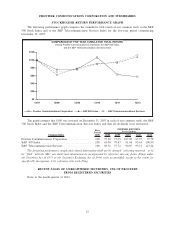
STOCKHOLDER RETURN PERFORMANCE GRAPH
The following performance graph compares the cumulative total return of our common stock to the S&P
500 Stock Index and to the S&P Telecommunication Services Index for the five-year period commencing
December 31, 2007.
COMPARISON OF FIVE YEAR CUMULATIVE TOTAL RETURN
Among Frontier Communications Corporation, the S&P 500 index,
and the S&P Telecommunication Services Index
Frontier Communications Corporation S&P 500 Index S&P Telecommunications Services
$0
$20
$40
$60
$80
$100
$120
12/1212/1112/1012/0912/0812/07
The graph assumes that $100 was invested on December 31, 2007 in each of our common stock, the S&P
500 Stock Index and the S&P Telecommunication Services Index and that all dividends were reinvested.
Company/Index
Base
Period
12/07 12/08 12/09 12/10 12/11 12/12
INDEXED RETURNS
Years Ending
Frontier Communications Corporation................... 100 75.50 77.05 107.09 63.37 57.78
S&P 500 Index........................................ 100 63.00 79.67 91.68 93.61 108.59
S&P Telecommunication Services ...................... 100 69.51 75.72 90.07 95.72 113.24
The foregoing performance graph and related information shall not be deemed “soliciting material” or to
be “filed” with the SEC, nor shall such information be incorporated by reference into any future filings under
the Securities Act of 1933 or the Securities Exchange Act of 1934, each as amended, except to the extent we
specifically incorporate it by reference into such filing.
RECENT SALES OF UNREGISTERED SECURITIES, USE OF PROCEEDS
FROM REGISTERED SECURITIES
None in the fourth quarter of 2012.
27
FRONTIER COMMUNICATIONS CORPORATION AND SUBSIDIARIES