Frontier Communications 2012 Annual Report Download - page 41
Download and view the complete annual report
Please find page 41 of the 2012 Frontier Communications annual report below. You can navigate through the pages in the report by either clicking on the pages listed below, or by using the keyword search tool below to find specific information within the annual report.-
 1
1 -
2
-
3
-
4
-
5
-
6
-
7
-
8
-
9
-
10
-
11
-
12
-
13
-
14
-
15
-
16
-
17
-
18
-
19
-
20
-
21
-
22
-
23
-
24
-
25
-
26
-
27
-
28
-
29
-
30
-
 31
31 -
 32
32 -
 33
33 -
 34
34 -
 35
35 -
 36
36 -
 37
37 -
 38
38 -
 39
39 -
 40
40 -
 41
41 -
 42
42 -
 43
43 -
 44
44 -
 45
45 -
 46
46 -
 47
47 -
 48
48 -
 49
49 -
 50
50 -
 51
51 -
52
-
53
-
54
-
55
-
56
-
57
-
58
-
59
-
60
-
61
-
62
-
63
-
64
-
65
-
66
-
67
-
68
-
69
-
70
-
71
-
72
-
73
-
74
-
75
-
76
-
77
-
78
-
79
-
80
-
81
-
82
-
83
-
84
-
85
-
86
-
87
-
88
-
89
-
90
-
91
-
92
-
93
-
94
-
95
-
96
-
97
-
98
-
99
-
100
-
101
-
102
-
103
-
104
-
105
-
106
 |
 |
Since the completion of the Transaction on July 1, 2010, we have focused on integrating the operations
and converging the processes of the Acquired Business to effectively operate as one business. During the past
two years, we have worked with Verizon and our third party actuaries to merge the plans, finalize the transfer
of plan assets and ensure we have all the information necessary to make well informed decisions. Based on the
underlying changes in demographics and cash flows, we amended the estimation techniques regarding its
actuarial assumptions, where appropriate, across all of our pension and postretirement plans. The most
significant of such changes was in the estimation technique utilized to develop the discount rate for its pension
and postretirement benefit plans. The revised estimation technique is based upon a settlement model
(Bond:Link) of such liabilities as of December 31, 2012 that permits us to more closely match cash flows to the
expected payments to participants than would be possible with the previously used yield curve model. We
believe such a change results in an estimate of the discount rate that more accurately reflects the settlement
value for plan obligations than the different yield curve methodologies used in prior years, as it provides the
ability to review the quality and diversification of the portfolio to select the bond issues that would settle the
obligation in an optimal manner. This rate can change from year-to-year based on market conditions that affect
corporate bond yields.
In determining the discount rate as of December 31, 2011 and 2010, we considered, among other things,
the yields on the Citigroup Above Median Pension Curve, the Towers Watson Index, the general movement of
interest rates and the changes in those rates from one period to the next.
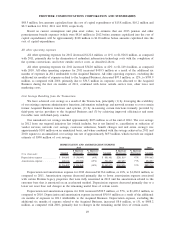
As a result of the change described above, Frontier is utilizing a discount rate of 4.00% as of December
31, 2012 for its qualified pension plan, compared to rates of 4.50% and 5.25% in 2011 and 2010, respectively.
The discount rate using the previous estimation technique would have been 3.75%, resulting in an immaterial
impact to the projected benefit obligation at December 31, 2012 in comparison to the 4.00% discount rate. The
discount rate for postretirement plans as of December 31, 2012 was a range of 4.00% to 4.20% compared to a
range of 4.50% to 4.75% in 2011 and 5.25% in 2010.
The expected long-term rate of return on plan assets is applied in the determination of periodic pension
and postretirement benefit cost as a reduction in the computation of the expense. In developing the expected
long-term rate of return assumption, we considered published surveys of expected market returns, 10 and 20
year actual returns of various major indices, and our own historical 5 year, 10 year and 20 year investment
returns. The expected long-term rate of return on plan assets is based on an asset allocation assumption of 35%
to 55% in fixed income securities, 35% to 55% in equity securities and 5% to 15% in alternative investments.
We review our asset allocation at least annually and make changes when considered appropriate. Our asset
return assumption is made at the beginning of our fiscal year. In 2010, 2011 and 2012, our expected long-term
rate of return on plan assets was 8.0%, 8.0% and 7.75%, respectively. Our actual return on plan assets in 2012
was 11.1%. For 2013, we will assume a rate of return of 8.0%. Our pension plan assets are valued at fair value
as of the measurement date.
We expect that our pension and other postretirement benefit expenses for 2013 will be approximately $100
million to $110 million before amounts capitalized into the cost of capital expenditures. In 2012, they were
$81.6 million before amounts capitalized into the cost of capital expenditures. We expect to make contributions
to our pension plan of approximately $60 million in 2013. We made net contributions to our pension plan of
$28.6 million in 2012, consisting of cash payments of $18.3 million and $10.3 million during the third and
fourth quarter of 2012, respectively. We made contributions to our pension plan of $76.7 million in 2011,
consisting of cash payments of $18.6 million and the contribution of real property with a fair value of $58.1
million. We made cash contributions of $13.1 million in 2010.
Income Taxes
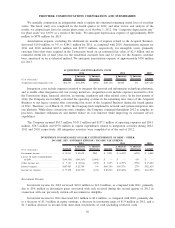
Our effective tax rate was 33.0% in 2012 as compared to 35.9% in 2011 and 42.5% in 2010. Income taxes
for 2012 include the net reversal of reserves for uncertain tax positions for $12.3 million, partially offset by
increases in deferred tax balances to reflect changes in estimates and changes in state effective rates and filing
methods.
Income taxes for 2011 include the reduction of deferred tax balances based on the application of enacted
state tax statutes for $6.8 million and the net reversal of a reserve for uncertain tax positions for $9.9 million,
40
FRONTIER COMMUNICATIONS CORPORATION AND SUBSIDIARIES