Frontier Communications 2012 Annual Report Download - page 30
Download and view the complete annual report
Please find page 30 of the 2012 Frontier Communications annual report below. You can navigate through the pages in the report by either clicking on the pages listed below, or by using the keyword search tool below to find specific information within the annual report.-
 1
1 -
2
-
3
-
4
-
5
-
6
-
7
-
8
-
9
-
10
-
11
-
12
-
13
-
14
-
15
-
16
-
17
-
18
-
19
-
 20
20 -
 21
21 -
 22
22 -
 23
23 -
 24
24 -
 25
25 -
 26
26 -
 27
27 -
 28
28 -
 29
29 -
 30
30 -
 31
31 -
 32
32 -
 33
33 -
 34
34 -
 35
35 -
 36
36 -
 37
37 -
 38
38 -
 39
39 -
 40
40 -
41
-
42
-
43
-
44
-
45
-
46
-
47
-
48
-
49
-
50
-
51
-
52
-
53
-
54
-
55
-
56
-
57
-
58
-
59
-
60
-
61
-
62
-
63
-
64
-
65
-
66
-
67
-
68
-
69
-
70
-
71
-
72
-
73
-
74
-
75
-
76
-
77
-
78
-
79
-
80
-
81
-
82
-
83
-
84
-
85
-
86
-
87
-
88
-
89
-
90
-
91
-
92
-
93
-
94
-
95
-
96
-
97
-
98
-
99
-
100
-
101
-
102
-
103
-
104
-
105
-
106
 |
 |

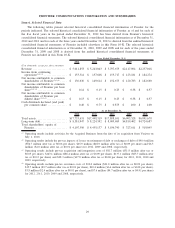
Item 6. Selected Financial Data
The following tables present selected historical consolidated financial information of Frontier for the
periods indicated. The selected historical consolidated financial information of Frontier as of and for each of
the five fiscal years in the period ended December 31, 2012 has been derived from Frontier’s historical
consolidated financial statements. The selected historical consolidated financial information as of December 31,
2012 and 2011 and for each of the three years ended December 31, 2012 is derived from the audited historical
consolidated financial statements of Frontier included elsewhere in this Form 10-K. The selected historical
consolidated financial information as of December 31, 2010, 2009 and 2008 and for each of the years ended
December 31, 2009 and 2008 is derived from the audited historical consolidated financial statements of
Frontier not included in this Form 10-K.
2012 2011 2010 2009 2008
Year Ended December 31,(1)
($ in thousands, except per share amounts)
Revenue . . ......................... $ 5,011,853 $ 5,243,043 $ 3,797,675 $2,117,894 $2,237,018
Income from continuing
operations(2)(3)(4) .................. $ 153,314 $ 157,608 $ 155,717 $ 123,181 $ 184,274
Net income attributable to common
shareholders of Frontier(2)(3)(4) ..... $ 136,636 $ 149,614 $ 152,673 $ 120,783 $ 182,660
Net income attributable to common
shareholders of Frontier per basic
share(2)(3)(4) ....................... $ 0.14 $ 0.15 $ 0.23 $ 0.38 $ 0.57
Net income attributable to common
shareholders of Frontier per
diluted share(2)(3)(4) ................ $ 0.13 $ 0.15 $ 0.23 $ 0.38 $ 0.57
Cash dividends declared (and paid)
per common share ............... $ 0.40 $ 0.75 $ 0.875 $ 1.00 $ 1.00
2012 2011 2010 2009 2008
As of December 31,
Total assets ........................ $17,733,631 $17,448,319 $17,888,101 $6,903,528 $6,891,678
Long-term debt..................... $ 8,381,947 $ 8,224,392 $ 8,005,685 $4,819,402 $4,724,687
Total shareholders’ equity of
Frontier. ......................... $ 4,107,596 $ 4,455,137 $ 5,196,740 $ 327,611 $ 519,045
(1) Operating results include activities for the Acquired Business from the date of its acquisition from Verizon on
July 1, 2010.
(2) Operating results include the pre-tax impacts of losses on retirement of debt or exchanges of debt of $90.4 million
($56.7 million after tax or $0.06 per share), $45.9 million ($28.9 million after tax or $0.09 per share) and $6.3
million ($4.0 million after tax or $0.01 per share) for 2012, 2009 and 2008, respectively.
(3) Operating results include pre-tax acquisition and integration costs of $81.7 million ($51.8 million after tax or
$0.05 per share), $143.1 million ($88.4 million after tax or $0.09 per share), $137.1 million ($85.7 million after
tax or $0.13 per share) and $28.3 million ($17.8 million after tax or $0.06 per share) for 2012, 2011, 2010 and
2009, respectively.
(4) Operating results include pre-tax severance costs of $32.0 million ($21.0 million after tax or $0.02 per share),
$15.7 million ($9.7 million after tax or $0.01 per share), $10.4 million ($6.4 million after tax or $0.01 per share),
$3.8 million ($2.4 million after tax or $0.01 per share), and $7.6 million ($4.7 million after tax or $0.01 per share)
for 2012, 2011, 2010, 2009 and 2008, respectively.
29
FRONTIER COMMUNICATIONS CORPORATION AND SUBSIDIARIES