Energizer 2013 Annual Report Download - page 97
Download and view the complete annual report
Please find page 97 of the 2013 Energizer annual report below. You can navigate through the pages in the report by either clicking on the pages listed below, or by using the keyword search tool below to find specific information within the annual report.-
 1
1 -
2
-
3
-
4
-
5
-
6
-
7
-
8
-
9
-
10
-
11
-
12
-
13
-
14
-
15
-
16
-
17
-
18
-
19
-
20
-
21
-
22
-
23
-
24
-
25
-
26
-
27
-
28
-
29
-
30
-
31
-
32
-
33
-
34
-
35
-
36
-
37
-
38
-
39
-
40
-
41
-
42
-
43
-
44
-
45
-
46
-
47
-
48
-
49
-
50
-
51
-
52
-
53
-
54
-
55
-
56
-
57
-
58
-
59
-
60
-
61
-
62
-
63
-
64
-
65
-
66
-
67
-
68
-
69
-
70
-
71
-
72
-
73
-
74
-
75
-
76
-
77
-
78
-
79
-
80
-
81
-
82
-
83
-
84
-
85
-
86
-
 87
87 -
 88
88 -
 89
89 -
 90
90 -
 91
91 -
 92
92 -
 93
93 -
 94
94 -
 95
95 -
 96
96 -
 97
97 -
 98
98 -
 99
99 -
 100
100 -
 101
101 -
 102
102 -
 103
103 -
 104
104 -
 105
105 -
 106
106 -
 107
107 -
108
-
109
-
110
-
111
-
112
-
113
-
114
-
115
-
116
-
117
-
118
-
119
-
120
 |
 |
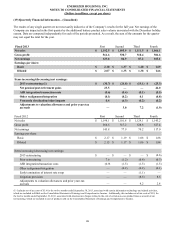
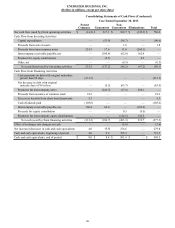
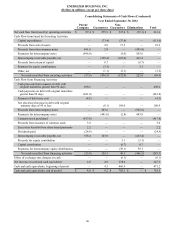
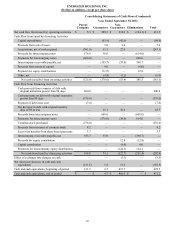
ENERGIZER HOLDINGS, INC.
NOTES TO CONSOLIDATED FINANCIAL STATEMENTS
(Dollars in millions, except per share)
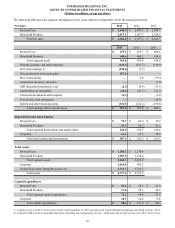
The following table provides segment information for the years ended or at September 30 for the periods presented:
Net Sales 2013 2012 2011
Personal Care $ 2,448.9 $ 2,479.5 $ 2,449.7
Household Products 2,017.1 2,087.7 2,196.0
Total net sales $ 4,466.0 $ 4,567.2 $ 4,645.7
2013 2012 2011
Personal Care $ 475.2 $ 470.7 $ 408.4
Household Products 440.6 400.2 410.6
Total segment profit 915.8 870.9 819.0
General corporate and other expenses (141.5)(151.7)(119.9)
2013 restructuring (1) (150.6)(7.3)—
Net pension/post-retirement gains 107.6 ——
Prior restructuring —6.8 (79.0)
Acquisition inventory valuation ——(7.0)
ASR integration/transaction costs (2.5)(8.4)(13.5)
Amortization of intangibles (20.1)(22.7)(21.3)
Venezuela devaluation/other impacts (6.3)—(1.8)
Cost of early debt retirements ——(19.9)
Interest and other financing items (134.5)(122.2)(150.6)
Total earnings before income taxes $ 567.9 $ 565.4 $ 406.0
Depreciation and Amortization
Personal Care $ 72.7 $ 82.0 $ 78.9
Household Products 53.3 54.7 63.5
Total segment depreciation and amortization 126.0 136.7 142.4
Corporate 61.4 25.5 38.9
Total depreciation and amortization $ 187.4 $ 162.2 $ 181.3
Total Assets
Personal Care $ 1,208.3 $ 1,278.4
Household Products 1,033.0 1,134.4
Total segment assets 2,241.3 2,412.8
Corporate 1,164.8 995.2
Goodwill and other intangible assets, net 3,311.3 3,323.2
Total assets $ 6,717.4 $ 6,731.2
Capital Expenditures
Personal Care $ 54.3 $ 58.3 $ 61.0
Household Products 17.8 38.1 36.6
Total segment capital expenditures 72.1 96.4 97.6
Corporate 18.5 14.6 0.4
Total capital expenditures $ 90.6 $ 111.0 $ 98.0
(1) Includes pre-tax costs $5.2, for the twelve months ended September 30, 2013, associated with certain information technology and related activities, which
are included in SG&A on the Consolidated Statements of Earnings and Comprehensive Income. Additionally, this includes pre-tax costs of $6.1 for the twelve
87