Energizer 2013 Annual Report Download - page 50
Download and view the complete annual report
Please find page 50 of the 2013 Energizer annual report below. You can navigate through the pages in the report by either clicking on the pages listed below, or by using the keyword search tool below to find specific information within the annual report.-
 1
1 -
2
-
3
-
4
-
5
-
6
-
7
-
8
-
9
-
10
-
11
-
12
-
13
-
14
-
15
-
16
-
17
-
18
-
19
-
20
-
21
-
22
-
23
-
24
-
25
-
26
-
27
-
28
-
29
-
30
-
31
-
32
-
33
-
34
-
35
-
36
-
37
-
38
-
39
-
 40
40 -
 41
41 -
 42
42 -
 43
43 -
 44
44 -
 45
45 -
 46
46 -
 47
47 -
 48
48 -
 49
49 -
 50
50 -
 51
51 -
 52
52 -
 53
53 -
 54
54 -
 55
55 -
 56
56 -
 57
57 -
 58
58 -
 59
59 -
 60
60 -
61
-
62
-
63
-
64
-
65
-
66
-
67
-
68
-
69
-
70
-
71
-
72
-
73
-
74
-
75
-
76
-
77
-
78
-
79
-
80
-
81
-
82
-
83
-
84
-
85
-
86
-
87
-
88
-
89
-
90
-
91
-
92
-
93
-
94
-
95
-
96
-
97
-
98
-
99
-
100
-
101
-
102
-
103
-
104
-
105
-
106
-
107
-
108
-
109
-
110
-
111
-
112
-
113
-
114
-
115
-
116
-
117
-
118
-
119
-
120
 |
 |

ENERGIZER HOLDINGS, INC.
(Dollars in millions, except per share data)
HOUSEHOLD PRODUCTS
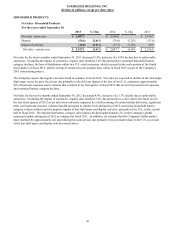
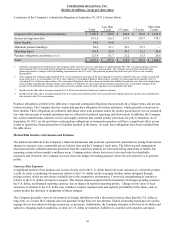
Net Sales - Household Products
For the years ended September 30,
2013 % Chg 2012 % Chg 2011
Net sales - prior year $ 2,087.7 $ 2,196.0 $ 2,199.7
Organic (54.6) (2.6)% (70.6) (3.2)% (53.6)
Impact of currency (16.0) (0.8)% (37.7) (1.7)% 49.9
Net sales - current year $ 2,017.1 (3.4)% $ 2,087.7 (4.9)% $ 2,196.0
Net sales for the twelve months ended September 30, 2013 decreased 3.4%, inclusive of a 0.8% decline due to unfavorable
currencies. Excluding the impact of currencies, organic sales declined 2.6% due primarily to continued household battery
category declines, the loss of distribution within two U.S. retail customers, which occurred in the early portion of the fourth
fiscal quarter of fiscal 2013, and the exiting of certain non-core product lines earlier in fiscal 2013 as part of the Company's
2013 restructuring project.
The Company expects the negative net sales trend to continue in fiscal 2014. Net sales are expected to decline in the mid-single
digit range versus the prior fiscal year due primarily to the full year impact of the loss of two U.S. customers, approximately
$18 of hurricane response storm volumes that occurred in the first quarter of fiscal 2013 that are not forecasted to be repeated,
and continued battery category declines.
Net Sales for the twelve months ended September 30, 2012 decreased 4.9%, inclusive of a 1.7% decline due to unfavorable
currencies. Excluding the impact of currencies, organic sales declined 3.2% due primarily to a slow start to the fiscal year in
the first fiscal quarter of 2012 as net sales were adversely impacted by a shift in timing of retailer holiday deliveries, significant
prior year hurricane response volumes that did not repeat at similar levels during fiscal 2012, increasing household battery
category volume softness and the negative impact of lost shelf space and display activities, primarily in the U.S., in the second
half of fiscal 2012. We estimate that battery category unit volumes declined approximately 5% in the Company's global
measured markets during fiscal 2012 as compared to fiscal 2011. In addition, we estimate that the Company's dollar market
share declined by approximately one point during this same period, due primarily to lower market share in the U.S. as a result
of the lost shelf space and display activities noted above.
40