Energizer 2013 Annual Report Download - page 48
Download and view the complete annual report
Please find page 48 of the 2013 Energizer annual report below. You can navigate through the pages in the report by either clicking on the pages listed below, or by using the keyword search tool below to find specific information within the annual report.-
 1
1 -
2
-
3
-
4
-
5
-
6
-
7
-
8
-
9
-
10
-
11
-
12
-
13
-
14
-
15
-
16
-
17
-
18
-
19
-
20
-
21
-
22
-
23
-
24
-
25
-
26
-
27
-
28
-
29
-
30
-
31
-
32
-
33
-
34
-
35
-
36
-
37
-
 38
38 -
 39
39 -
 40
40 -
 41
41 -
 42
42 -
 43
43 -
 44
44 -
 45
45 -
 46
46 -
 47
47 -
 48
48 -
 49
49 -
 50
50 -
 51
51 -
 52
52 -
 53
53 -
 54
54 -
 55
55 -
 56
56 -
 57
57 -
 58
58 -
59
-
60
-
61
-
62
-
63
-
64
-
65
-
66
-
67
-
68
-
69
-
70
-
71
-
72
-
73
-
74
-
75
-
76
-
77
-
78
-
79
-
80
-
81
-
82
-
83
-
84
-
85
-
86
-
87
-
88
-
89
-
90
-
91
-
92
-
93
-
94
-
95
-
96
-
97
-
98
-
99
-
100
-
101
-
102
-
103
-
104
-
105
-
106
-
107
-
108
-
109
-
110
-
111
-
112
-
113
-
114
-
115
-
116
-
117
-
118
-
119
-
120
 |
 |

ENERGIZER HOLDINGS, INC.
(Dollars in millions, except per share data)
This structure is the basis for the Company’s reportable operating segment information, as included in the tables in Note 18 of
the Notes to Consolidated Financial Statements for the fiscal years ended September 30, 2013, 2012 and 2011.
For the fiscal year ended September 30, 2013, the Company recorded $139.3 in restructuring charges related to its 2013
restructuring. The 2013 restructuring charges were reported on a separate line in the Consolidated Statements of Earnings and
Comprehensive Income. In addition, pre-tax costs of $5.2, for the twelve months ended September 30, 2013, associated with
certain information technology enablement activities related to our restructuring initiatives were included in SG&A on the
Consolidated Statement of Earnings and Comprehensive Income. Also, pre-tax costs of $6.1, for the twelve months ended
September 30, 2013, associated with obsolescence charges related to the exit of certain non-core product lines as part of our
restructuring, were included in cost of products sold on the Consolidated Statements of Earnings and Comprehensive Income.
The information technology costs and non-core inventory obsolescence charges are considered part of the total project costs
incurred for our restructuring initiative in fiscal 2013. In fiscal 2012, the Company recorded $7.3 of charges for the 2013
restructuring plan related to consulting costs. See Note 3 of the Notes to Consolidated Financial Statements.
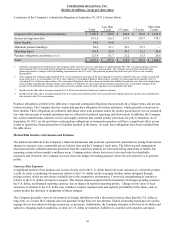
In fiscal 2013, the Company approved and communicated changes to certain pension and post-retirement benefits. Effective
January 1, 2014, the pension benefit earned to date by active participants under the legacy Energizer U.S. pension plan will be
frozen and future service benefits will no longer be accrued under this retirement program. Additionally, and effective on
December 31, 2013, certain post-retirement medical and life insurance benefits will be terminated. As a result of these actions,
the Company recorded pre-tax pension and post-retirement benefit gains of $107.6 for the twelve months ended September 30,
2013. The collective gains resulting from these actions, net of the above noted pension settlement charge, were reported on a
separate line in the Consolidated Statements of Earnings and Comprehensive Income. See Note 9 of the Notes to Consolidated
Financial Statements.
For the twelve months ended September 30, 2012, our prior Household Products restructuring activities generated pre-tax
income of $6.8. The prior year pre-tax income was due to the gain on the sale of our former battery manufacturing facility in
Switzerland, which was shut down in fiscal 2011. This gain was approximately $13. This gain was offset by additional
restructuring costs of $6.0. These costs, net of the gain on the sale of the former manufacturing facility in fiscal 2012, are
included as a separate line item on the Consolidated Statements of Earnings and Comprehensive Income.
The Personal Care and Household Products tables provided below are intended to provide insights on the changes in net sales
and segment profit. The impact of currency noted on these tables includes the impact of the Venezuela devaluation on segment
operating results.
PERSONAL CARE
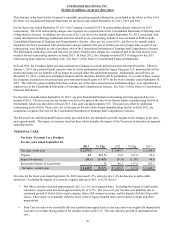
Net Sales - Personal Care Products
For the years ended September 30,
2013 % Chg 2012 % Chg 2011
Net sales - prior year $ 2,479.5 $ 2,449.7 $ 2,048.6
Organic 4.1 0.2 % 15.0 0.6 % 92.8
Impact of currency (34.7) (1.4)% (31.4) (1.3)% 46.0
Incremental impact of acquisitions ——% 46.2 1.9 % 262.3
Net sales - current year $ 2,448.9 (1.2)% $ 2,479.5 1.2 % $ 2,449.7
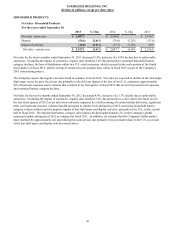
Net sales for the fiscal year ended September 30, 2013 decreased 1.2%, inclusive of a 1.4% decline due to unfavorable
currencies. Excluding the impact of currencies, organic sales grew $4.1, or 0.2%, due to:
• Wet Shave net sales declined approximately $25, or 1.5%, on a reported basis. Excluding the impact of unfavorable
currencies, organic sales increased approximately $8, or 0.5%. The year-over-year increase was primarily due to
continued growth of Schick Hydro men's systems, Hydro Silk women's systems, and the launch of Hydro Disposable
razors. These gains were partially offset by lower sales of legacy branded men's and women's systems and shave
preparations,
• Skin Care net sales were essentially flat on a reported and organic basis as sun care sales were negatively impacted by
cool and wet weather during much of the summer season in the U.S. This was offset by growth in international sun
care,
38