Energizer 2013 Annual Report Download - page 74
Download and view the complete annual report
Please find page 74 of the 2013 Energizer annual report below. You can navigate through the pages in the report by either clicking on the pages listed below, or by using the keyword search tool below to find specific information within the annual report.-
 1
1 -
2
-
3
-
4
-
5
-
6
-
7
-
8
-
9
-
10
-
11
-
12
-
13
-
14
-
15
-
16
-
17
-
18
-
19
-
20
-
21
-
22
-
23
-
24
-
25
-
26
-
27
-
28
-
29
-
30
-
31
-
32
-
33
-
34
-
35
-
36
-
37
-
38
-
39
-
40
-
41
-
42
-
43
-
44
-
45
-
46
-
47
-
48
-
49
-
50
-
51
-
52
-
53
-
54
-
55
-
56
-
57
-
58
-
59
-
60
-
61
-
62
-
63
-
 64
64 -
 65
65 -
 66
66 -
 67
67 -
 68
68 -
 69
69 -
 70
70 -
 71
71 -
 72
72 -
 73
73 -
 74
74 -
 75
75 -
 76
76 -
 77
77 -
 78
78 -
 79
79 -
 80
80 -
 81
81 -
 82
82 -
 83
83 -
 84
84 -
85
-
86
-
87
-
88
-
89
-
90
-
91
-
92
-
93
-
94
-
95
-
96
-
97
-
98
-
99
-
100
-
101
-
102
-
103
-
104
-
105
-
106
-
107
-
108
-
109
-
110
-
111
-
112
-
113
-
114
-
115
-
116
-
117
-
118
-
119
-
120
 |
 |

ENERGIZER HOLDINGS, INC.
(Dollars in millions, except per share data)
Objectives of this plan include:
• Reduce global workforce by more than 10%, or approximately 1,500 colleagues;
• Rationalize and streamline operations facilities in the Household Products Division;
• Consolidate G&A functional support across the organization;
• Streamline the Household Products Division product portfolio to enable increased focus on our core battery and
portable lighting businesses;
• Streamline the marketing organization within our Household Products Division;
• Optimize our go-to-market strategies and organization structures within our international markets;
• Reduce overhead spending, including changes to benefit programs and other targeted spending reductions; and
• Create a center-led purchase function to drive procurement savings.
For the twelve months ended September 30, 2013, significant progress has been made against all of the aforementioned
objectives. Headcount reductions have totaled nearly 1,400.
For the twelve months ended September 30, 2013, the Company recorded pre-tax expense of $139.3 for charges related to the
2013 restructuring plan including:
• Non-cash asset impairment charges of $19.3 and accelerated depreciation charges of $23.6 for the twelve months
ended September 30, 2013, (collectively for the twelve months, $42.9) related primarily to completed and upcoming
plant closures,
• Severance and related benefit costs of $49.3 for the twelve months ended September 30, 2013, associated with staffing
reductions that have been identified to date, and
• Consulting, program management and other charges associated with the restructuring of $47.1 for the twelve months
ended September 30, 2013.
The 2013 restructuring costs are reported on a separate line in the Consolidated Statements of Earnings and Comprehensive
Income. In addition, pre-tax costs of $5.2 for the twelve months ended September 30, 2013, associated with certain
information technology enablement activities related to our restructuring initiatives were included in SG&A on the
Consolidated Statements of Earnings and Comprehensive Income. Also, pre-tax costs of $6.1, for the twelve months ended
September 30, 2013, associated with obsolescence charges related to the exit of certain non-core product lines as part of our
restructuring are included in Cost of products sold on the Consolidated Statements of Earnings and Comprehensive Income.
The information technology costs and non-core inventory obsolescence charges are considered part of the total project costs
incurred for our restructuring initiative. In fiscal 2012 the Company recorded $7.3 of costs associated with consulting activities
related to the 2013 restructuring plan.
A summary of the estimated remaining costs for the 2013 restructuring is as follows. Totals, as well as category ranges, are
estimates.
• Approximately $10-$20 related to plant closure and accelerated depreciation charges,
• Approximately $40-$50 related to severance and related benefit costs,
• Approximately $20-$30 related to consulting and program management, and
• Approximately $5-$15 related to other restructuring related costs.
Cost remaining associated with certain information technology enablement activities related to our restructuring initiatives are
approximately $15-$25. In addition, the Company expects to incur incremental capital expenditures of approximately $20-$25
over the next 12 months, related primarily to information technology enablement of certain restructuring initiatives.
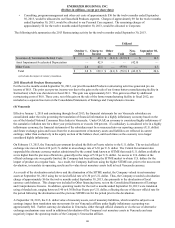
The Company does not include the 2013 restructuring costs in the results of its reportable segments. The estimated pre-tax
impact of allocating such charges to segment results would have been as follows:
• Non-cash impairment and accelerated depreciation charges of approximately $43 for the twelve months ended
September 30, 2013, would be fully allocated to our Household Products segment.
• Severance and related benefit costs of approximately $42 for the twelve months ended September 30, 2013, would be
allocated to our Household Products segment. Charges of approximately $6 for the twelve months ended September
30, 2013, would be allocated to our Personal Care segment. The remaining charges of approximately $1 for the
twelve months ended September 30, 2013, would be allocated to Corporate. As certain headcount provides services to
both segments, charges for severance and related benefits for such headcount requires an allocation.
64