Energizer 2013 Annual Report Download - page 87
Download and view the complete annual report
Please find page 87 of the 2013 Energizer annual report below. You can navigate through the pages in the report by either clicking on the pages listed below, or by using the keyword search tool below to find specific information within the annual report.-
 1
1 -
2
-
3
-
4
-
5
-
6
-
7
-
8
-
9
-
10
-
11
-
12
-
13
-
14
-
15
-
16
-
17
-
18
-
19
-
20
-
21
-
22
-
23
-
24
-
25
-
26
-
27
-
28
-
29
-
30
-
31
-
32
-
33
-
34
-
35
-
36
-
37
-
38
-
39
-
40
-
41
-
42
-
43
-
44
-
45
-
46
-
47
-
48
-
49
-
50
-
51
-
52
-
53
-
54
-
55
-
56
-
57
-
58
-
59
-
60
-
61
-
62
-
63
-
64
-
65
-
66
-
67
-
68
-
69
-
70
-
71
-
72
-
73
-
74
-
75
-
76
-
 77
77 -
 78
78 -
 79
79 -
 80
80 -
 81
81 -
 82
82 -
 83
83 -
 84
84 -
 85
85 -
 86
86 -
 87
87 -
 88
88 -
 89
89 -
 90
90 -
 91
91 -
 92
92 -
 93
93 -
 94
94 -
 95
95 -
 96
96 -
 97
97 -
98
-
99
-
100
-
101
-
102
-
103
-
104
-
105
-
106
-
107
-
108
-
109
-
110
-
111
-
112
-
113
-
114
-
115
-
116
-
117
-
118
-
119
-
120
 |
 |

ENERGIZER HOLDINGS, INC.
NOTES TO CONSOLIDATED FINANCIAL STATEMENTS
(Dollars in millions, except per share)
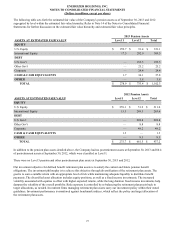
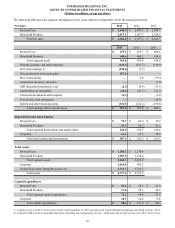
The following table sets forth the estimated fair value of the Company’s pension assets as of September 30, 2013 and 2012
segregated by level within the estimated fair value hierarchy. Refer to Note 14 of the Notes to Consolidated Financial
Statements for further discussion on the estimated fair value hierarchy and estimated fair value principles.
2013 Pension Assets
ASSETS AT ESTIMATED FAIR VALUE Level 1 Level 2 Total
EQUITY
U.S. Equity $ 259.7 $ 91.4 $ 351.1
International Equity 17.5 292.0 309.5
DEBT
U.S. Gov't — 253.5 253.5
Other Gov't — 25.2 25.2
Corporate — 29.4 29.4
CASH & CASH EQUIVALENTS 1.7 36.1 37.8
OTHER — 5.8 5.8
TOTAL $ 278.9 $ 733.4 $ 1,012.3
2012 Pension Assets
ASSETS AT ESTIMATED FAIR VALUE Level 1 Level 2 Total
EQUITY
U.S. Equity $ 259.1 $ 51.9 $ 311.0
International Equity 15.3 248.3 263.6
DEBT
U.S. Gov't — 294.8 294.8
Other Gov't — 8.8 8.8
Corporate — 49.2 49.2
CASH & CASH EQUIVALENTS 1.3 — 1.3
OTHER — 8.5 8.5
TOTAL $ 275.7 $ 661.5 $ 937.2
In addition to the pension plan assets detailed above, the Company had no postretirement assets at September 30, 2013 and $0.4
of postretirement assets at September 30, 2012, which were classified as Level 1.
There were no Level 3 pension and other postretirement plan assets at September 30, 2013 and 2012.
Our investment objective for defined benefit retirement plan assets is to satisfy the current and future pension benefit
obligations. The investment philosophy is to achieve this objective through diversification of the retirement plan assets. The
goal is to earn a suitable return with an appropriate level of risk while maintaining adequate liquidity to distribute benefit
payments. The diversified asset allocation includes equity positions, as well as a fixed income investments. The increased
volatility associated with equities is offset with higher expected returns, while the long duration fixed income investments help
dampen the volatility of the overall portfolio. Risk exposure is controlled by re-balancing the retirement plan assets back to
target allocations, as needed. Investment firms managing retirement plan assets carry out investment policy within their stated
guidelines. Investment performance is monitored against benchmark indices, which reflect the policy and target allocation of
the retirement plan assets.
77