Energizer 2013 Annual Report Download - page 86
Download and view the complete annual report
Please find page 86 of the 2013 Energizer annual report below. You can navigate through the pages in the report by either clicking on the pages listed below, or by using the keyword search tool below to find specific information within the annual report.-
 1
1 -
2
-
3
-
4
-
5
-
6
-
7
-
8
-
9
-
10
-
11
-
12
-
13
-
14
-
15
-
16
-
17
-
18
-
19
-
20
-
21
-
22
-
23
-
24
-
25
-
26
-
27
-
28
-
29
-
30
-
31
-
32
-
33
-
34
-
35
-
36
-
37
-
38
-
39
-
40
-
41
-
42
-
43
-
44
-
45
-
46
-
47
-
48
-
49
-
50
-
51
-
52
-
53
-
54
-
55
-
56
-
57
-
58
-
59
-
60
-
61
-
62
-
63
-
64
-
65
-
66
-
67
-
68
-
69
-
70
-
71
-
72
-
73
-
74
-
75
-
 76
76 -
 77
77 -
 78
78 -
 79
79 -
 80
80 -
 81
81 -
 82
82 -
 83
83 -
 84
84 -
 85
85 -
 86
86 -
 87
87 -
 88
88 -
 89
89 -
 90
90 -
 91
91 -
 92
92 -
 93
93 -
 94
94 -
 95
95 -
 96
96 -
97
-
98
-
99
-
100
-
101
-
102
-
103
-
104
-
105
-
106
-
107
-
108
-
109
-
110
-
111
-
112
-
113
-
114
-
115
-
116
-
117
-
118
-
119
-
120
 |
 |

ENERGIZER HOLDINGS, INC.
NOTES TO CONSOLIDATED FINANCIAL STATEMENTS
(Dollars in millions, except per share)
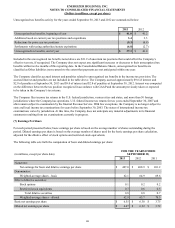
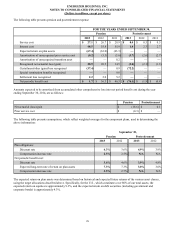
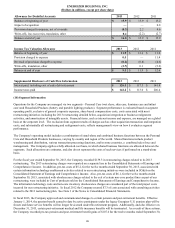
The following table presents pension and postretirement expense:
FOR THE YEARS ENDED SEPTEMBER 30,
Pension Postretirement
2013 2012 2011 2013 2012 2011
Service cost $ 27.1 $ 26.7 $ 28.9 $ 0.4 $ 0.5 $ 0.5
Interest cost 48.5 55.8 55.9 1.4 2.3 2.7
Expected return on plan assets (67.4)(63.0)(63.3)———
Amortization of unrecognized prior service cost (0.2)(5.5)(5.6)(3.7)(2.6)(2.7)
Amortization of unrecognized transition asset —— 0.2 ———
Recognized net actuarial loss/(gain) 28.9 20.3 14.5 (2.0)(2.1)(1.3)
Curtailment/other (gain)/loss recognized (37.4)— 0.9 (72.2)——
Special termination benefits recognized —— 9.6 ———
Settlement loss recognized 2.2 2.0 5.2 ———
Net periodic benefit cost $ 1.7 $ 36.3 $ 46.3 $(76.1)$(1.9)$ (0.8)
Amounts expected to be amortized from accumulated other comprehensive loss into net period benefit cost during the year
ending September 30, 2014, are as follows:
Pension Postretirement
Net actuarial (loss)/gain $ (18.6) $ 0.1
Prior service cost $ (0.3)$ —
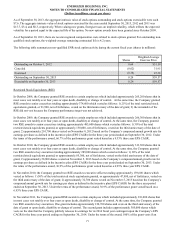
The following table presents assumptions, which reflect weighted-averages for the component plans, used in determining the
above information:
September 30,
Pension Postretirement
2013 2012 2013 2012
Plan obligations:
Discount rate 4.3% 3.6% 4.9% 3.9%
Compensation increase rate 2.5% 2.5% N/A N/A
Net periodic benefit cost:
Discount rate 3.6% 4.6% 3.9% 4.8%
Expected long-term rate of return on plan assets 7.3% 7.3% 3.0% 3.0%
Compensation increase rate 2.5% 2.7% N/A N/A
The expected return on plan assets was determined based on historical and expected future returns of the various asset classes,
using the target allocations described above. Specifically, for the U.S., which constitutes over 80% of our total assets, the
expected return on equities is approximately 9.3%, and the expected return on debt securities (including government and
corporate bonds) is approximately 4.3%.
76