Energizer 2013 Annual Report Download - page 10
Download and view the complete annual report
Please find page 10 of the 2013 Energizer annual report below. You can navigate through the pages in the report by either clicking on the pages listed below, or by using the keyword search tool below to find specific information within the annual report.-
 1
1 -
 2
2 -
 3
3 -
 4
4 -
 5
5 -
 6
6 -
 7
7 -
 8
8 -
 9
9 -
 10
10 -
 11
11 -
 12
12 -
 13
13 -
 14
14 -
 15
15 -
 16
16 -
 17
17 -
 18
18 -
 19
19 -
 20
20 -
 21
21 -
22
-
23
-
24
-
25
-
26
-
27
-
28
-
29
-
30
-
31
-
32
-
33
-
34
-
35
-
36
-
37
-
38
-
39
-
40
-
41
-
42
-
43
-
44
-
45
-
46
-
47
-
48
-
49
-
50
-
51
-
52
-
53
-
54
-
55
-
56
-
57
-
58
-
59
-
60
-
61
-
62
-
63
-
64
-
65
-
66
-
67
-
68
-
69
-
70
-
71
-
72
-
73
-
74
-
75
-
76
-
77
-
78
-
79
-
80
-
81
-
82
-
83
-
84
-
85
-
86
-
87
-
88
-
89
-
90
-
91
-
92
-
93
-
94
-
95
-
96
-
97
-
98
-
99
-
100
-
101
-
102
-
103
-
104
-
105
-
106
-
107
-
108
-
109
-
110
-
111
-
112
-
113
-
114
-
115
-
116
-
117
-
118
-
119
-
120
 |
 |
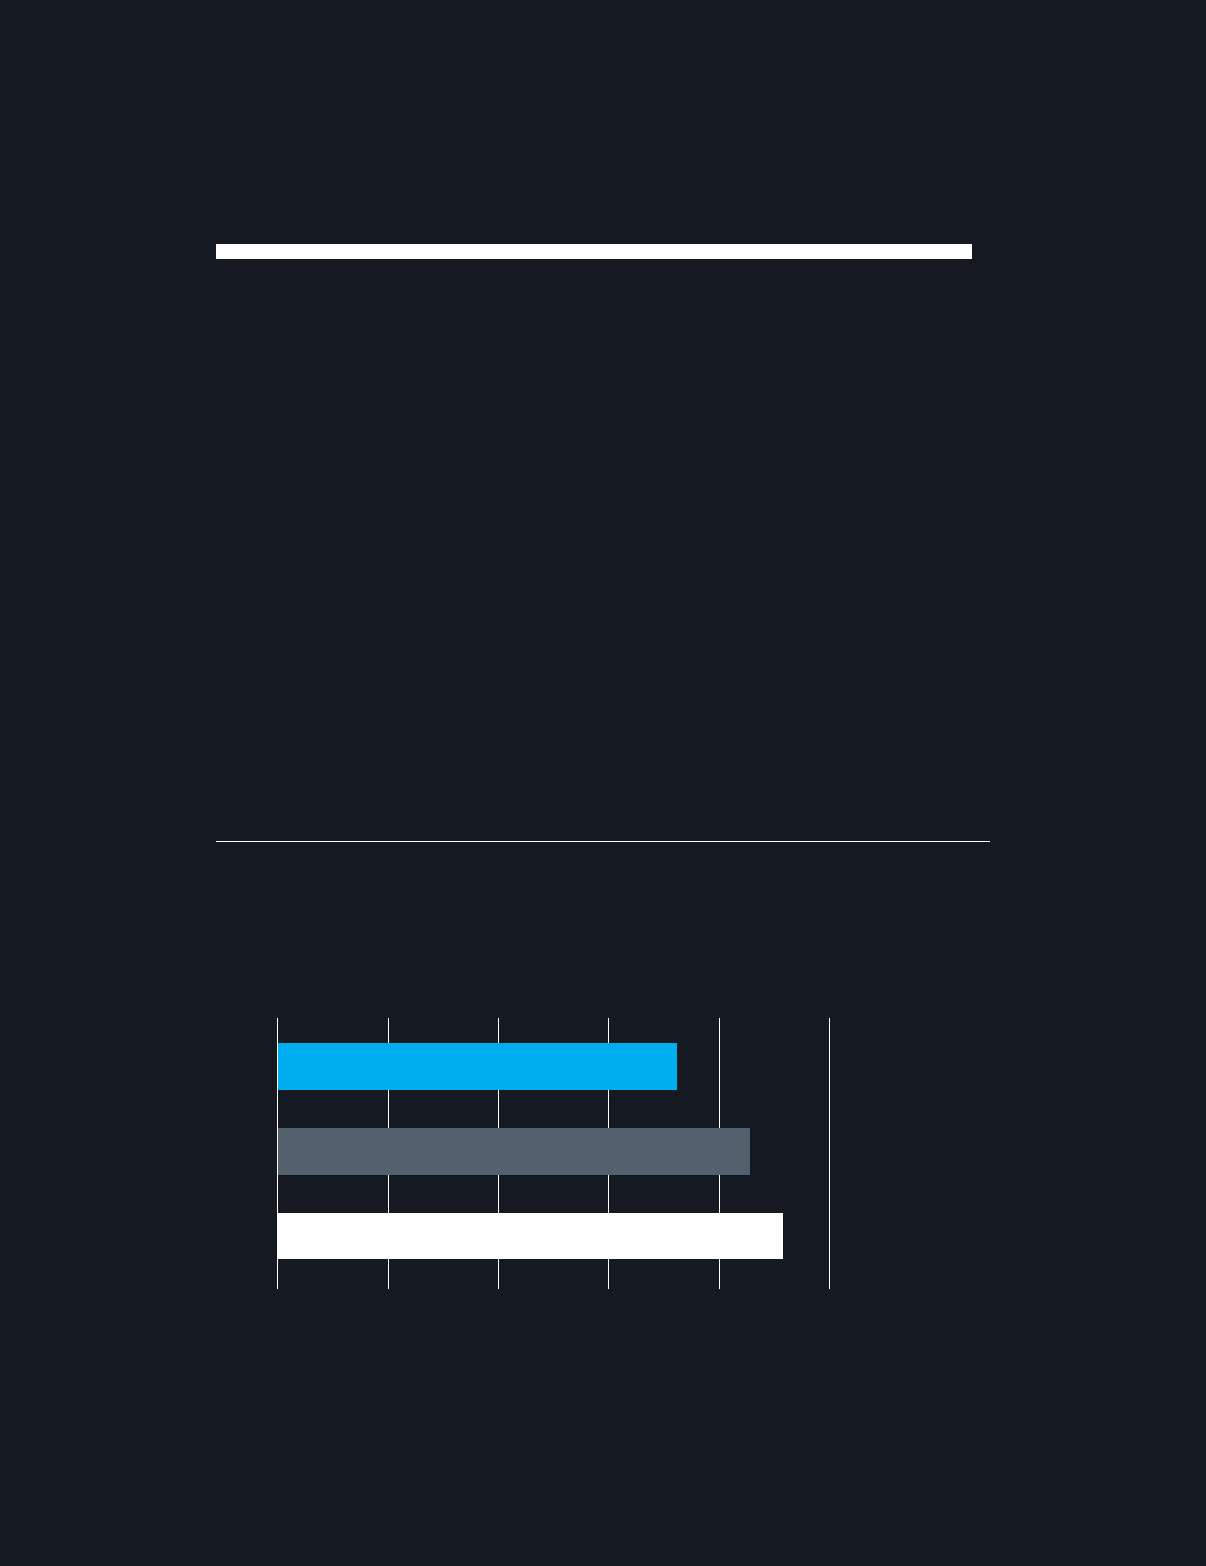
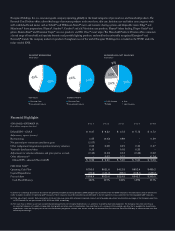
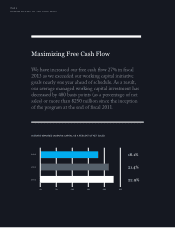
AVERAGE MANAGED WORKING CAPITAL AS A PERCENT OF NET SALES
0% 5% 10% 15% 20% 25%
2013
2012
2011
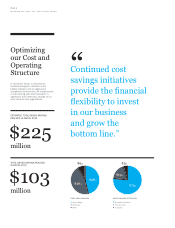
Maximizing Free Cash Flow
We have increased our free cash ow 27% in scal
2013 as we exceeded our working capital initiative
goals nearly one year ahead of schedule. As a result,
our average managed working capital investment has
decreased by 480 basis points (as a percentage of net
sales) or more than $250 million since the inception
of the program at the end of scal 2011.
PAGE 8
ENERGIZER HOLDINGS, INC. 2013 ANNUAL REPORT
22.9%
21.4%
18.1%