Energizer 2013 Annual Report Download - page 31
Download and view the complete annual report
Please find page 31 of the 2013 Energizer annual report below. You can navigate through the pages in the report by either clicking on the pages listed below, or by using the keyword search tool below to find specific information within the annual report.-
 1
1 -
2
-
3
-
4
-
5
-
6
-
7
-
8
-
9
-
10
-
11
-
12
-
13
-
14
-
15
-
16
-
17
-
18
-
19
-
20
-
 21
21 -
 22
22 -
 23
23 -
 24
24 -
 25
25 -
 26
26 -
 27
27 -
 28
28 -
 29
29 -
 30
30 -
 31
31 -
 32
32 -
 33
33 -
 34
34 -
 35
35 -
 36
36 -
 37
37 -
 38
38 -
 39
39 -
 40
40 -
 41
41 -
42
-
43
-
44
-
45
-
46
-
47
-
48
-
49
-
50
-
51
-
52
-
53
-
54
-
55
-
56
-
57
-
58
-
59
-
60
-
61
-
62
-
63
-
64
-
65
-
66
-
67
-
68
-
69
-
70
-
71
-
72
-
73
-
74
-
75
-
76
-
77
-
78
-
79
-
80
-
81
-
82
-
83
-
84
-
85
-
86
-
87
-
88
-
89
-
90
-
91
-
92
-
93
-
94
-
95
-
96
-
97
-
98
-
99
-
100
-
101
-
102
-
103
-
104
-
105
-
106
-
107
-
108
-
109
-
110
-
111
-
112
-
113
-
114
-
115
-
116
-
117
-
118
-
119
-
120
 |
 |
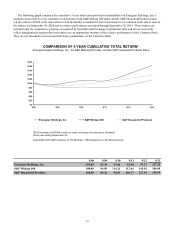
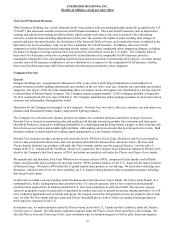
The following graph compares the cumulative 5-year total return provided to shareholders on Energizer Holdings, Inc.'s
common stock relative to the cumulative total returns of the S&P Midcap 400 index and the S&P Household Products index.
An investment of $100 (with reinvestment of all dividends) is assumed to have been made in our common stock and in each of
the indexes on September 30, 2008 and its relative performance is tracked through September 30, 2013. These indices are
included only for comparative purposes as required by Securities and Exchange Commission rules and do not necessarily
reflect management's opinion that such indices are an appropriate measure of the relative performance of the Common Stock.
They are not intended to forecast possible future performance of the Common Stock.
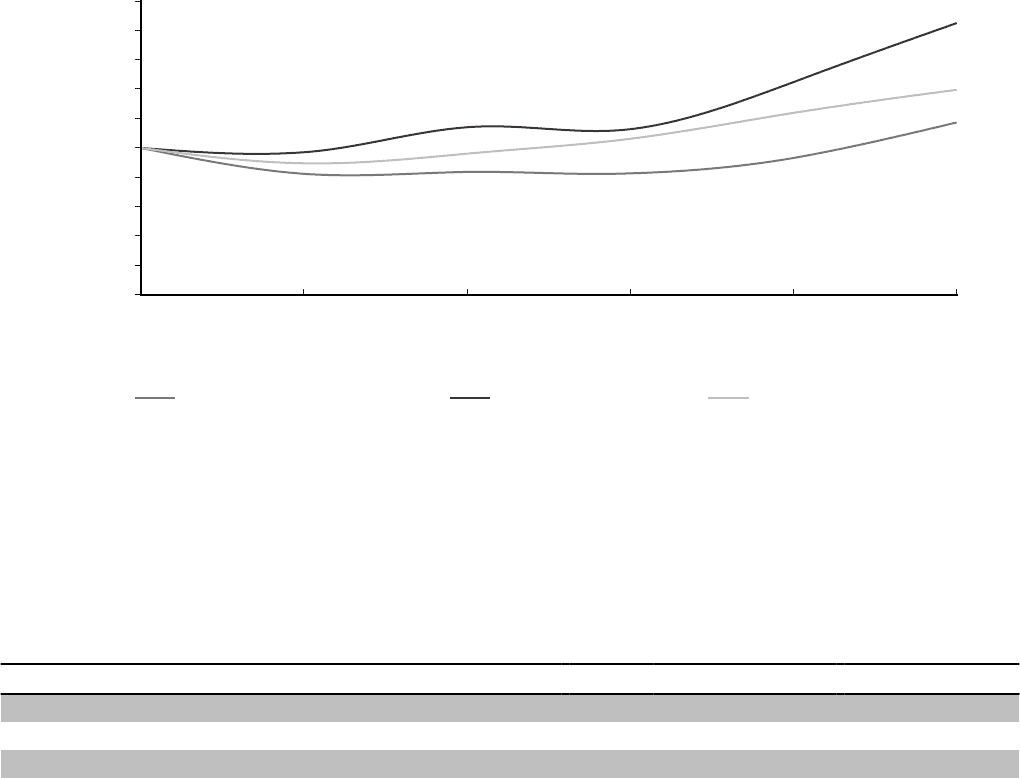
9/08 9/09 9/10 9/11 9/12 9/13
Energizer Holdings, Inc. 100.00 82.36 83.46 82.48 93.17 117.29
S&P Midcap 400 100.00 96.89 114.11 112.66 144.81 184.89
S&P Household Products 100.00 89.42 96.01 106.17 123.69 139.59
21
COMPARISON OF 5 YEAR CUMULATIVE TOTAL RETURN*
Among Energizer Holdings, Inc., the S&P Midcap 400 Index, and the S&P Household Products Index
Energizer Holdings, Inc.
*$100 invested on 9/30/08 in stock or index, including reinvestment of dividends.
Fiscal year ending September 30.
Copyright© 2013 S&P, a division of The McGraw - HillCompanies Inc. All rights reserved.
S&P Midcap 400 S&P Household Products
$0
9/08 9/09 9/10 9/11 9/12 9/13
$20
$40
$60
$80
$100
$120
$140
$160
$180
$200