Energizer 2013 Annual Report Download - page 66
Download and view the complete annual report
Please find page 66 of the 2013 Energizer annual report below. You can navigate through the pages in the report by either clicking on the pages listed below, or by using the keyword search tool below to find specific information within the annual report.-
 1
1 -
2
-
3
-
4
-
5
-
6
-
7
-
8
-
9
-
10
-
11
-
12
-
13
-
14
-
15
-
16
-
17
-
18
-
19
-
20
-
21
-
22
-
23
-
24
-
25
-
26
-
27
-
28
-
29
-
30
-
31
-
32
-
33
-
34
-
35
-
36
-
37
-
38
-
39
-
40
-
41
-
42
-
43
-
44
-
45
-
46
-
47
-
48
-
49
-
50
-
51
-
52
-
53
-
54
-
55
-
 56
56 -
 57
57 -
 58
58 -
 59
59 -
 60
60 -
 61
61 -
 62
62 -
 63
63 -
 64
64 -
 65
65 -
 66
66 -
 67
67 -
 68
68 -
 69
69 -
 70
70 -
 71
71 -
 72
72 -
 73
73 -
 74
74 -
 75
75 -
 76
76 -
77
-
78
-
79
-
80
-
81
-
82
-
83
-
84
-
85
-
86
-
87
-
88
-
89
-
90
-
91
-
92
-
93
-
94
-
95
-
96
-
97
-
98
-
99
-
100
-
101
-
102
-
103
-
104
-
105
-
106
-
107
-
108
-
109
-
110
-
111
-
112
-
113
-
114
-
115
-
116
-
117
-
118
-
119
-
120
 |
 |

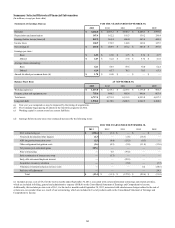
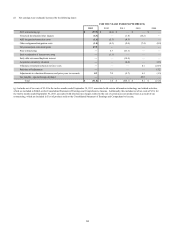
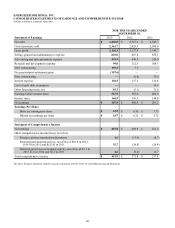
ENERGIZER HOLDINGS, INC.
CONSOLIDATED STATEMENTS OF EARNINGS AND COMPREHENSIVE INCOME
(Dollars in millions, except per share data)
FOR THE YEARS ENDED
SEPTEMBER 30,
Statement of Earnings 2013 2012 2011
Net sales $ 4,466.0 $ 4,567.2 $ 4,645.7
Cost of products sold 2,361.7 2,429.3 2,500.0
Gross profit 2,104.3 2,137.9 2,145.7
Selling, general and administrative expense 825.0 887.8 856.1
Advertising and sales promotion expense 439.9 449.5 524.0
Research and development expense 99.0 112.5 108.3
2013 restructuring 139.3 7.3 —
Net pension/post-retirement gains (107.6)——
Prior restructuring —(6.8) 79.0
Interest expense 130.5 127.3 121.4
Cost of early debt retirements —— 19.9
Other financing items, net 10.3 (5.1) 31.0
Earnings before income taxes 567.9 565.4 406.0
Income taxes 160.9 156.5 144.8
Net earnings $ 407.0 $ 408.9 $ 261.2
Earnings Per Share
Basic net earnings per share $ 6.55 $ 6.30 $ 3.75
Diluted net earnings per share $ 6.47 $ 6.22 $ 3.72
Statement of Comprehensive Income
Net earnings $ 407.0 $ 408.9 $ 261.2
Other comprehensive income/(loss), net of tax
Foreign currency translation adjustments 4.6 (11.9)(8.7)
Pension/postretirement activity, net of tax of $18.9 in 2013,
$(14.4) in 2012 and $(25.6) in 2011 35.7 (24.8)(26.4)
Deferred gain/(loss) on hedging activity, net of tax of $3.1 in
2013 $1.6 in 2012 and $5.3 in 2011 4.6 (0.4) 11.7
Total comprehensive income $ 451.9 $ 371.8 $ 237.8
The above financial statements should be read in conjunction with the Notes To Consolidated Financial Statements.
56