Energizer 2013 Annual Report Download - page 56
Download and view the complete annual report
Please find page 56 of the 2013 Energizer annual report below. You can navigate through the pages in the report by either clicking on the pages listed below, or by using the keyword search tool below to find specific information within the annual report.-
 1
1 -
2
-
3
-
4
-
5
-
6
-
7
-
8
-
9
-
10
-
11
-
12
-
13
-
14
-
15
-
16
-
17
-
18
-
19
-
20
-
21
-
22
-
23
-
24
-
25
-
26
-
27
-
28
-
29
-
30
-
31
-
32
-
33
-
34
-
35
-
36
-
37
-
38
-
39
-
40
-
41
-
42
-
43
-
44
-
45
-
 46
46 -
 47
47 -
 48
48 -
 49
49 -
 50
50 -
 51
51 -
 52
52 -
 53
53 -
 54
54 -
 55
55 -
 56
56 -
 57
57 -
 58
58 -
 59
59 -
 60
60 -
 61
61 -
 62
62 -
 63
63 -
 64
64 -
 65
65 -
 66
66 -
67
-
68
-
69
-
70
-
71
-
72
-
73
-
74
-
75
-
76
-
77
-
78
-
79
-
80
-
81
-
82
-
83
-
84
-
85
-
86
-
87
-
88
-
89
-
90
-
91
-
92
-
93
-
94
-
95
-
96
-
97
-
98
-
99
-
100
-
101
-
102
-
103
-
104
-
105
-
106
-
107
-
108
-
109
-
110
-
111
-
112
-
113
-
114
-
115
-
116
-
117
-
118
-
119
-
120
 |
 |

ENERGIZER HOLDINGS, INC.
(Dollars in millions, except per share data)
Interest Rate Exposure
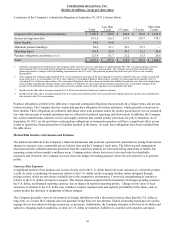
At September 30, 2013 and 2012, the fair market value of the Company's fixed rate debt is estimated at $2,262.3 and $2,438.0,
respectively, using yields obtained from independent pricing sources for similar types of borrowing arrangements. The
estimated fair value of debt is greater than the carrying value of the Company's debt by approximately $124 and $174 at
September 30, 2013 and 2012, respectively. A 10% decrease in interest rates on fixed-rate debt would have increased the fair
market value by approximately $47 and $54 at September 30, 2013 and 2012, respectively. See Note 11 of the Notes to
Consolidated Financial Statements for additional information regarding the Company’s debt.
Through December 2012, the Company had specific interest rate risk with respect to interest expense on the Company's former
term loan, which was repaid by the end of the first quarter of fiscal 2013. As a result, the interest rate swap agreement in place
to hedge this specific risk was settled at that time for a $0.3 loss. This loss was included in interest expense in the Consolidated
Statements of Earnings and Comprehensive Income. At September 30, 2013, the Company had $99.0 of variable rate debt
outstanding, which was primarily outstanding borrowings under the Company's receivable securitization program.
Stock Price Exposure
The Company holds a share option with a major financial institution, which matures in November 2014, to mitigate the impact
of changes in certain of the Company’s unfunded deferred compensation liabilities, which are tied to the Company’s common
stock price. The fair market value of the share option held by the Company was $7.7 and $2.5 as included in other current
assets at September 30, 2013 and 2012, respectively. The change in estimated fair value of the total share option for fiscal 2013
and 2012 resulted in income in both periods of $15.5 and of $6.1, respectively, and was recorded in SG&A. Period activity
related to the share option is classified in the same category in the Consolidated Statements of Cash Flows as the period activity
associated with the Company’s unfunded deferred compensation liability, which was in cash flow from operations.
Seasonal Factors
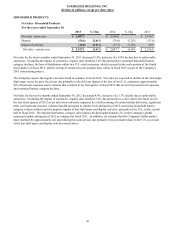
The Company's Household Products segment results are typically impacted in the first quarter of the fiscal year by the
additional sales volume associated with the December holiday season, particularly in North America. First quarter sales
accounted for approximately 32% of total Household Products net sales in fiscal 2013 and approximately 30% in fiscal 2012
and 2011. In addition, natural disasters, such as hurricanes, can create conditions that drive exceptional needs for portable
power and may result in a short term increase in battery and lighting products sales. This was recently evident as the Company
estimates that incremental volume in response to Hurricane Sandy added approximately $18 to sales in the first fiscal quarter
of 2013.
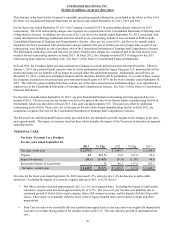
Customer orders for the Company’s sun care products are highly seasonal, which has historically resulted in higher sun care
sales in the second and third quarters of our fiscal year and lower sales in the first and fourth quarters of our fiscal year. As a
result, sales, operating income, working capital and cash flows for the Personal Care segment can vary significantly between
quarters of the same and different years due to the seasonality and timing of orders for sun care products as well as the potential
impact of weather patterns on sun care sales and consumption.
Other factors may also have an impact on the timing and amounts of sales, operating income, working capital and cash flows.
Such as: the timing of new product launches by competitors or by the Company, the timing of advertising, promotional,
merchandising or other marketing activities by competitors or by the Company, and the timing of retailer merchandising
decisions and actions.
Other Matters
Environmental Matters
The operations of the Company, like those of other companies, are subject to various federal, state, foreign and local laws and
regulations intended to protect the public health and the environment. These regulations relate primarily to worker safety, air
and water quality, underground fuel storage tanks and waste handling and disposal. The Company has received notices from the
U.S. Environmental Protection Agency, state agencies and/or private parties seeking contribution, that it has been identified as a
“potentially responsible party” (PRP) under the Comprehensive Environmental Response, Compensation and Liability Act, and
may be required to share in the cost of cleanup with respect to eight federal “Superfund” sites. It may also be required to share
in the cost of cleanup with respect to state-designated sites or other sites outside of the U.S.
Accrued environmental costs at September 30, 2013 were $19.3, of which $4.7 is expected to be spent in fiscal 2014. It is
difficult to quantify with certainty the cost of environmental matters, particularly remediation and future capital expenditures
for environmental control equipment. Total environmental capital expenditures and operating expenses are not expected to
46