Energizer 2013 Annual Report Download - page 47
Download and view the complete annual report
Please find page 47 of the 2013 Energizer annual report below. You can navigate through the pages in the report by either clicking on the pages listed below, or by using the keyword search tool below to find specific information within the annual report.-
 1
1 -
2
-
3
-
4
-
5
-
6
-
7
-
8
-
9
-
10
-
11
-
12
-
13
-
14
-
15
-
16
-
17
-
18
-
19
-
20
-
21
-
22
-
23
-
24
-
25
-
26
-
27
-
28
-
29
-
30
-
31
-
32
-
33
-
34
-
35
-
36
-
 37
37 -
 38
38 -
 39
39 -
 40
40 -
 41
41 -
 42
42 -
 43
43 -
 44
44 -
 45
45 -
 46
46 -
 47
47 -
 48
48 -
 49
49 -
 50
50 -
 51
51 -
 52
52 -
 53
53 -
 54
54 -
 55
55 -
 56
56 -
 57
57 -
58
-
59
-
60
-
61
-
62
-
63
-
64
-
65
-
66
-
67
-
68
-
69
-
70
-
71
-
72
-
73
-
74
-
75
-
76
-
77
-
78
-
79
-
80
-
81
-
82
-
83
-
84
-
85
-
86
-
87
-
88
-
89
-
90
-
91
-
92
-
93
-
94
-
95
-
96
-
97
-
98
-
99
-
100
-
101
-
102
-
103
-
104
-
105
-
106
-
107
-
108
-
109
-
110
-
111
-
112
-
113
-
114
-
115
-
116
-
117
-
118
-
119
-
120
 |
 |

ENERGIZER HOLDINGS, INC.
(Dollars in millions, except per share data)
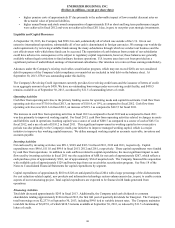
Other financing, net was expense of $10.3 in fiscal 2013, including approximately $6 related to the Venezuela currency
devaluation in the second fiscal quarter of 2013. The remaining expense was due primarily to a loss of approximately $3
related to the wind down of certain commodity derivative contracts. In fiscal 2012, other financing, net was $5.1 of income due
primarily to $4.5 of interest income, as overall foreign exchange gains and losses were immaterial in the aggregate.
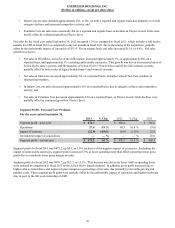
Income Taxes
Income taxes, which include federal, state and foreign taxes, were 28.3%, 27.7% and 35.7% of earnings before income taxes in
fiscal 2013, 2012 and 2011, respectively.
For fiscal 2013, the effective tax rate was 28.3%, which was favorably impacted by costs associated with our 2013 restructuring
initiative that have been primarily incurred in the U.S., which has resulted in a higher tax benefit as compared to our overall
global effective tax rate, and to a lesser extent, the favorable impact of items such as the retroactive reinstatement of the
Research and Development (R&D) credit. Offsetting a portion of this favorability was the income tax provision associated with
the net pension and postretirement gains recorded in fiscal 2013, as the tax provision related to the gains was recorded at the
higher U.S. rate.
For fiscal 2012, adjustments were recorded to reflect refinement of estimates of tax attributes to amounts in filed returns,
settlement of tax audits and other tax adjustments. These fiscal 2012 adjustments decreased the income tax provision by 120
basis points.
For fiscal 2011:
• The Household Products restructuring included significant costs incurred in countries with comparatively low effective
tax rates, which has the effect of increasing our overall effective tax rate due to a lower tax benefit associated with
these costs,
• Establishment of an estimated valuation allowance for certain tax loss carryforwards of $4.5 related to costs incurred
from the fiscal 2011 closure of the Swiss plant as part of the Household Products restructuring,
• Tax expense of $6.9 due to the establishment of a valuation allowance for certain foreign tax loss carryforwards, which
are no longer likely to be utilized, based on a recent evaluation,
• Adjustments were recorded to reflect refinement of estimates of tax attributes to amounts in filed returns, settlement of
tax audits and other tax adjustments. These fiscal 2011 adjustments decreased the income tax provision by $1.7, and
• A tax benefit of $2.6 was recorded in fiscal 2011 associated with the write-up and subsequent sale of inventory
acquired in the ASR acquisition
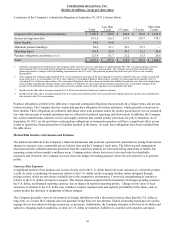
The Company's effective tax rate is highly sensitive to the mix of countries, from which earnings or losses are derived.
Declines in earnings in lower tax rate countries, earnings increases in higher tax rate countries, repatriation of foreign earnings
or operating losses in the future could increase future tax rates. Additionally, adjustments to prior year tax provision estimates
could increase or decrease future tax provisions.
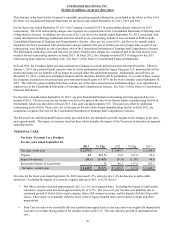
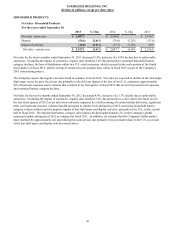
Segment Results
Operations for the Company are managed via two segments - Personal Care (wet shave, skin care, feminine care and infant
care) and Household Products (battery and portable lighting products). Segment performance is evaluated based on segment
operating profit, exclusive of general corporate expenses, share-based compensation costs, costs associated with most
restructuring initiatives including the 2013 restructuring detailed below, acquisition integration or business realignment
activities, amortization of intangible assets and other items determined to be corporate in nature. Financial items, such as
interest income and expense, are managed on a global basis at the corporate level. The exclusion from segment results of
charges such as other acquisition transaction and integration costs, and substantially all restructuring and realignment costs,
reflects management's view on how it evaluates segment performance.
The Company's operating model includes a combination of stand-alone and combined business functions between the Personal
Care and Household Products businesses, varying by country and region of the world. Shared functions include product
warehousing and distribution, various transaction processing functions, and in some countries, a combined sales force and
management. The Company applies a fully allocated cost basis, in which shared business functions are allocated between the
segments. Such allocations are estimates, and also do not represent the costs of such services if performed on a stand-alone
basis.
37