Energizer 2013 Annual Report Download - page 46
Download and view the complete annual report
Please find page 46 of the 2013 Energizer annual report below. You can navigate through the pages in the report by either clicking on the pages listed below, or by using the keyword search tool below to find specific information within the annual report.-
 1
1 -
2
-
3
-
4
-
5
-
6
-
7
-
8
-
9
-
10
-
11
-
12
-
13
-
14
-
15
-
16
-
17
-
18
-
19
-
20
-
21
-
22
-
23
-
24
-
25
-
26
-
27
-
28
-
29
-
30
-
31
-
32
-
33
-
34
-
35
-
 36
36 -
 37
37 -
 38
38 -
 39
39 -
 40
40 -
 41
41 -
 42
42 -
 43
43 -
 44
44 -
 45
45 -
 46
46 -
 47
47 -
 48
48 -
 49
49 -
 50
50 -
 51
51 -
 52
52 -
 53
53 -
 54
54 -
 55
55 -
 56
56 -
57
-
58
-
59
-
60
-
61
-
62
-
63
-
64
-
65
-
66
-
67
-
68
-
69
-
70
-
71
-
72
-
73
-
74
-
75
-
76
-
77
-
78
-
79
-
80
-
81
-
82
-
83
-
84
-
85
-
86
-
87
-
88
-
89
-
90
-
91
-
92
-
93
-
94
-
95
-
96
-
97
-
98
-
99
-
100
-
101
-
102
-
103
-
104
-
105
-
106
-
107
-
108
-
109
-
110
-
111
-
112
-
113
-
114
-
115
-
116
-
117
-
118
-
119
-
120
 |
 |

ENERGIZER HOLDINGS, INC.
(Dollars in millions, except per share data)
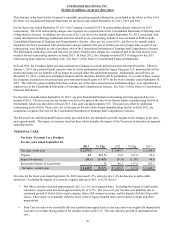
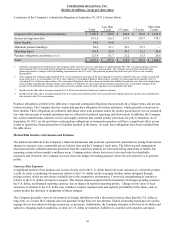
primarily by continued battery category declines and the negative impact of certain customer losses in the U.S. in the fiscal
fourth quarter.
Net sales for fiscal 2012 were $4,567.2, a decrease of $78.5, or 1.7%, as compared to fiscal 2011, including the unfavorable
impact of currencies of approximately $69. Excluding the unfavorable impact of currencies, sales were essentially flat as
incremental sales related to the full year ownership of American Safety Razor (ASR) and organic sales growth in Personal Care
were offset by declines in Household Products. Organically, net sales grew 0.6% in Personal Care, which was following mid-
single digit organic growth in fiscal 2011 as the prior year included continued launch activities for Schick Hydro. Organically,
net sales in Household Products declined 3.2% in fiscal 2012 due, in part, to continued category softness and a loss in market
share, primarily in the U.S., due to lost shelf space and display activities.
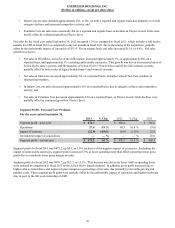
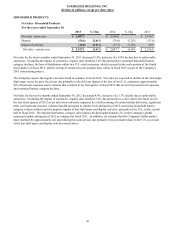
For further discussion regarding net sales in Personal Care and Household Products, including a summary of reported versus
organic changes, please see the section titled “Segment Results” provided below.
Gross Profit
Gross profit dollars were $2,104.3 in fiscal 2013, $2,137.9 in fiscal 2012 and $2,145.7 in fiscal 2011. The decrease in gross
profit in fiscal 2013 as compared to fiscal 2012 was due to the decline in net sales noted above including the impact of
unfavorable currencies.
Gross Margin as a percent of net sales for fiscal 2013 was 47.1%, up 30 basis points as compared to fiscal 2012. However,
excluding the unfavorable impact of currencies, gross margin as a percent of net sales for fiscal 2013 increased 80 basis points
versus fiscal 2012. This increase was driven by the favorable impact of our restructuring initiatives and lower product input
costs, most notably in Household Products.
Gross Margin as a percent of net sales for fiscal 2012 was 46.8%, up approximately 60 basis points as compared to fiscal 2011.
This increase in gross margin as a percent of net sales was more pronounced excluding the unfavorable impact of currencies,
which negatively impacted the fiscal 2012 versus fiscal 2011 comparison by approximately 40 basis points. Exclusive of the
unfavorable impact of currencies, gross margin as a percent of net sales improved approximately 100 basis points in fiscal 2012
as compared to fiscal 2011 due primarily to improved product costs, including the full year impact of savings from the 2011
Household Products manufacturing footprint changes, and the impact of favorable pricing and product costs in Personal Care.
Selling, General and Administrative
Selling, general and administrative expenses (SG&A) were $825.0 in fiscal 2013, or 18.5% of net sales as compared to $887.8,
or 19.4% of net sales for fiscal 2012 and $856.1, or 18.4% of net sales for fiscal 2011. Both the dollar decrease and the 90 basis
point reduction in SG&A as a percentage of net sales in fiscal 2013 as compared to fiscal 2012 were due primarily to cost
reductions associated with our restructuring initiatives and effective spending controls. Included in SG&A in fiscal 2013 was
approximately $5, pre tax, of information technology enablement costs directly associated with our restructuring initiatives.
Similarly, fiscal 2012 included approximately $7, pre-tax, of costs associated with the Company's initial enterprise-wide review
of its operating model and cost structure, which was the first step in our 2013 restructuring.
Advertising and Sales Promotion
For fiscal 2013, advertising and sales promotion (A&P) was $439.9, down $9.6 as compared to fiscal 2012. A&P as a percent
of net sales was 9.8% for both fiscal 2013 and fiscal 2012, and was 11.3% in fiscal 2011. The higher level of A&P spending in
relation to net sales in fiscal 2011 was due to significant launch activities for Schick Hydro, which were not repeated in the last
two fiscal years as the Schick Hydro launch matured. A&P expense may vary from year to year with new product launches, the
impact of acquisitions, strategic brand support initiatives, the overall competitive environment, and the state of the global
economy.
Research and Development
Research and development (R&D) expense was $99.0 in fiscal 2013, $112.5 in fiscal 2012 and $108.3 in fiscal 2011. The
decrease in fiscal 2013 was due primarily to lower costs in Household Products as a result of our restructuring initiatives. As a
percent of sales, R&D expense was approximately 2.2% in fiscal 2013, 2.5% in fiscal 2012 and 2.3% in fiscal 2011.
Interest, Other Financing, net and Cost of Early Debt Retirements
Interest expense for fiscal 2013 was $130.5, an increase of $3.2 as compared to fiscal 2012 due primarily to the combined
effects of higher average borrowings and a slightly higher average borrowing rate. Interest expense for fiscal 2012 was $127.3,
an increase of $5.9 as compared to fiscal 2011 for the same reasons noted above.
36