Energizer 2013 Annual Report Download - page 52
Download and view the complete annual report
Please find page 52 of the 2013 Energizer annual report below. You can navigate through the pages in the report by either clicking on the pages listed below, or by using the keyword search tool below to find specific information within the annual report.-
 1
1 -
2
-
3
-
4
-
5
-
6
-
7
-
8
-
9
-
10
-
11
-
12
-
13
-
14
-
15
-
16
-
17
-
18
-
19
-
20
-
21
-
22
-
23
-
24
-
25
-
26
-
27
-
28
-
29
-
30
-
31
-
32
-
33
-
34
-
35
-
36
-
37
-
38
-
39
-
40
-
41
-
 42
42 -
 43
43 -
 44
44 -
 45
45 -
 46
46 -
 47
47 -
 48
48 -
 49
49 -
 50
50 -
 51
51 -
 52
52 -
 53
53 -
 54
54 -
 55
55 -
 56
56 -
 57
57 -
 58
58 -
 59
59 -
 60
60 -
 61
61 -
 62
62 -
63
-
64
-
65
-
66
-
67
-
68
-
69
-
70
-
71
-
72
-
73
-
74
-
75
-
76
-
77
-
78
-
79
-
80
-
81
-
82
-
83
-
84
-
85
-
86
-
87
-
88
-
89
-
90
-
91
-
92
-
93
-
94
-
95
-
96
-
97
-
98
-
99
-
100
-
101
-
102
-
103
-
104
-
105
-
106
-
107
-
108
-
109
-
110
-
111
-
112
-
113
-
114
-
115
-
116
-
117
-
118
-
119
-
120
 |
 |

ENERGIZER HOLDINGS, INC.
(Dollars in millions, except per share data)
• higher pension costs of approximately $7 due primarily to the unfavorable impact of lower market discount rates on
the actuarial value of pension liabilities,
• higher annual bonus and stock award compensation of approximately $14 as short and long term performance targets
were achieved in fiscal 2012 and were not achieved in fiscal 2011 due, in part, to our prior year strategic investments.
Liquidity and Capital Resources
At September 30, 2013, the Company had $998.3 in cash, substantially all of which was outside of the U.S. Given our
extensive international operations, substantially all of our cash is denominated in foreign currencies. We manage our worldwide
cash requirements by reviewing available funds among the many subsidiaries through which we conduct our business and the
cost effectiveness with which those funds can be accessed. The repatriation of cash balances from certain of our subsidiaries
could have adverse tax consequences or be subject to regulatory capital requirements, however, those balances are generally
available without legal restrictions to fund ordinary business operations. U.S. income taxes have not been provided on a
significant portion of undistributed earnings of international subsidiaries. Our intention is to reinvest these earnings indefinitely.
Advances under the Company's existing receivables securitization program, which may not exceed $200, are not considered
debt for purposes of the Company’s debt compliance covenants but are included in total debt on the balance sheet. At
September 30, 2013, $78.0 was outstanding under this facility.
The Company's Revolving Credit Agreement currently provides for revolving credit loans and the issuance of letters of credit
in an aggregate amount of up to $450. We have no outstanding borrowings under our revolving credit facility, and $438.5
remains available as of September 30, 2013, as reduced by $11.5 of outstanding letters of credit.
Operating Activities
Cash flow from operating activities is the primary funding source for operating needs and capital investments. Cash flow from
operating activities was $750.0 in fiscal 2013, an increase of $118.4, or 19%, as compared to fiscal 2012. Cash flow from
operating activities was $631.6 in fiscal 2012, an increase of $219.1 as compared to $412.5 for fiscal 2011.
The increase in cash flow from operating activities in fiscal 2013 as compared to fiscal 2012 and as compared to fiscal 2011
was due primarily to improved working capital. For fiscal 2013, cash flow from operating activities related to changes in assets
and liabilities used in operations (working capital) was a source of cash of $208.7 as compared to a source of cash of $45.5 in
fiscal 2012, and a use of cash of $110.2 in fiscal 2011. This significant improvement in working capital in two consecutive
periods was due primarily to the Company's multi-year initiative to improve managed working capital, which is a major
initiative to improve key working capital measures. We define managed working capital as accounts receivable, inventory and
accounts payable.
Investing Activities
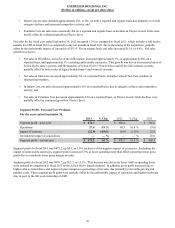
Net cash used by investing activities was $89.1, $94.9 and $363.5 in fiscal 2013, 2012 and 2011, respectively. Capital
expenditures were $90.6, $111.0 and $98.0 in fiscal 2013, 2012 and 2011, respectively. These capital expenditures were funded
by cash flow from operations. In addition to cash outflows related to capital expenditures, the most significant impact to cash
flow used by investing activities in fiscal 2011 was the acquisition of ASR for net cash of approximately $267, which reflects a
cash purchase price of approximately $301, net of approximately $34 of acquired cash. The Company financed this acquisition
with available cash of approximately $129 and borrowings from our receivables securitization program. See Note 18 of the
Notes to Consolidated Financial Statements for capital expenditures by segment.
Capital expenditures of approximately $100 to $120 are anticipated in fiscal 2014 with a large percentage of the disbursements
for cost reduction-related capital, new products and information technology system enhancements due, in part, to enable certain
aspects of our restructuring project. Total capital expenditures are expected to be financed with funds generated from
operations.
Financing Activities
Total debt decreased approximately $295 in fiscal 2013. Additionally, the Company paid cash dividends to common
shareholders totaling approximately $106 in fiscal 2013, the first full year of quarterly dividends for Energizer. The Company’s
total borrowings were $2,237.8 at September 30, 2013, including $99.0 tied to variable interest rates. The Company maintains
total debt facilities of $2,687.8, of which $438.5 remains available at September 30, 2013, as reduced by $11.5 of outstanding
letters of credit.
42