Energizer 2013 Annual Report Download - page 101
Download and view the complete annual report
Please find page 101 of the 2013 Energizer annual report below. You can navigate through the pages in the report by either clicking on the pages listed below, or by using the keyword search tool below to find specific information within the annual report.-
 1
1 -
2
-
3
-
4
-
5
-
6
-
7
-
8
-
9
-
10
-
11
-
12
-
13
-
14
-
15
-
16
-
17
-
18
-
19
-
20
-
21
-
22
-
23
-
24
-
25
-
26
-
27
-
28
-
29
-
30
-
31
-
32
-
33
-
34
-
35
-
36
-
37
-
38
-
39
-
40
-
41
-
42
-
43
-
44
-
45
-
46
-
47
-
48
-
49
-
50
-
51
-
52
-
53
-
54
-
55
-
56
-
57
-
58
-
59
-
60
-
61
-
62
-
63
-
64
-
65
-
66
-
67
-
68
-
69
-
70
-
71
-
72
-
73
-
74
-
75
-
76
-
77
-
78
-
79
-
80
-
81
-
82
-
83
-
84
-
85
-
86
-
87
-
88
-
89
-
90
-
 91
91 -
 92
92 -
 93
93 -
 94
94 -
 95
95 -
 96
96 -
 97
97 -
 98
98 -
 99
99 -
 100
100 -
 101
101 -
 102
102 -
 103
103 -
 104
104 -
 105
105 -
 106
106 -
 107
107 -
 108
108 -
 109
109 -
 110
110 -
 111
111 -
112
-
113
-
114
-
115
-
116
-
117
-
118
-
119
-
120
 |
 |

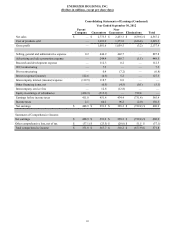
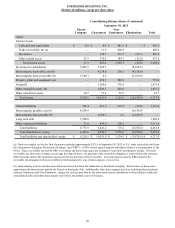
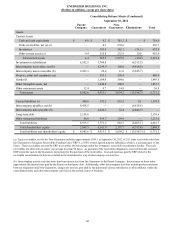
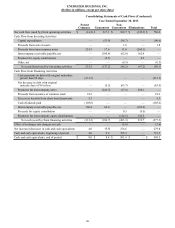
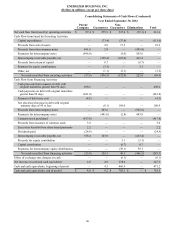
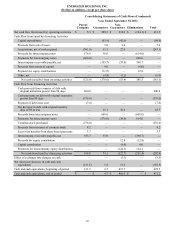
ENERGIZER HOLDINGS, INC.
(Dollars in millions, except per share data)
Consolidating Statements of Earnings (Condensed)
Year Ended September 30, 2012
Parent
Company Guarantors
Non-
Guarantors Eliminations Total
Net sales $ — $ 2,773.5 $ 2,433.3 $ (639.6) $ 4,567.2
Cost of products sold — 1,691.9 1,373.8 (636.4) 2,429.3
Gross profit — 1,081.6 1,059.5 (3.2) 2,137.9
Selling, general and administrative expense 0.2 444.9 442.7 — 887.8
Advertising and sales promotion expense — 249.9 200.7 (1.1) 449.5
Research and development expense — 112.3 0.2 — 112.5
2013 restructuring — 7.3 — — 7.3
Prior restructuring — 0.4 (7.2)—
(6.8)
Interest expense/(income) 122.6 (0.5) 5.2 — 127.3
Intercompany interest (income)/expense (119.5) 118.7 0.8 — —
Other financing items, net — (0.5)(4.5)(0.1)(5.1)
Intercompany service fees — 12.8 (12.8)— —
Equity in earnings of subsidiaries (414.3)(315.1) — 729.4 —
Earnings before income taxes 411.0 451.4 434.4 (731.4) 565.4
Income taxes 2.1 60.2 96.2 (2.0) 156.5
Net earnings $ 408.9 $ 391.2 $ 338.2 $ (729.4) $ 408.9
Statement of Comprehensive Income:
Net earnings $ 408.9 $ 391.2 $ 338.2 $ (729.4) $ 408.9
Other comprehensive loss, net of tax $ (37.1)$ (23.5)$ (28.0) $ 51.5 $ (37.1)
Total comprehensive income $ 371.8 $ 367.7 $ 310.2 $ (677.9) $ 371.8
91