Energizer 2013 Annual Report Download - page 75
Download and view the complete annual report
Please find page 75 of the 2013 Energizer annual report below. You can navigate through the pages in the report by either clicking on the pages listed below, or by using the keyword search tool below to find specific information within the annual report.-
 1
1 -
2
-
3
-
4
-
5
-
6
-
7
-
8
-
9
-
10
-
11
-
12
-
13
-
14
-
15
-
16
-
17
-
18
-
19
-
20
-
21
-
22
-
23
-
24
-
25
-
26
-
27
-
28
-
29
-
30
-
31
-
32
-
33
-
34
-
35
-
36
-
37
-
38
-
39
-
40
-
41
-
42
-
43
-
44
-
45
-
46
-
47
-
48
-
49
-
50
-
51
-
52
-
53
-
54
-
55
-
56
-
57
-
58
-
59
-
60
-
61
-
62
-
63
-
64
-
 65
65 -
 66
66 -
 67
67 -
 68
68 -
 69
69 -
 70
70 -
 71
71 -
 72
72 -
 73
73 -
 74
74 -
 75
75 -
 76
76 -
 77
77 -
 78
78 -
 79
79 -
 80
80 -
 81
81 -
 82
82 -
 83
83 -
 84
84 -
 85
85 -
86
-
87
-
88
-
89
-
90
-
91
-
92
-
93
-
94
-
95
-
96
-
97
-
98
-
99
-
100
-
101
-
102
-
103
-
104
-
105
-
106
-
107
-
108
-
109
-
110
-
111
-
112
-
113
-
114
-
115
-
116
-
117
-
118
-
119
-
120
 |
 |

ENERGIZER HOLDINGS, INC.
(Dollars in millions, except per share data)
• Consulting, program management and other exit costs of approximately $36 for the twelve months ended September
30, 2013, would be allocated to our Household Products segment. Charges of approximately $9 for the twelve months
ended September 30, 2013, would be allocated to our Personal Care segment. The remaining charges of
approximately $2 for the twelve months ended September 30, 2013, would be allocated to Corporate.
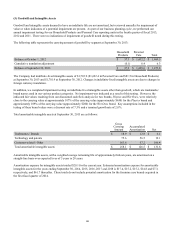
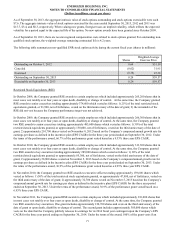
The following table summarizes the 2013 Restructuring activity for the twelve months ended September 30, 2013.
Utilized
October 1,
2012
Charge to
Income
Other
(a) Cash
Non-
Cash
September 30,
2013
Severance & Termination Related Costs $ — $ 49.3 $ (0.1)$ (32.9) $ — $ 16.3
Asset Impairment/Accelerated Depreciation — 42.9 — — (42.9)—
Other Costs 2.8 47.1 — (45.6) — 4.3
Total $ 2.8 $ 139.3 $ (0.1)$ (78.5)$ (42.9) $ 20.6
(a) Includes the impact of currency translation.
2011 Household Products Restructuring
For the twelve months ended September 30, 2012, our prior Household Products restructuring activities generated pre-tax
income of $6.8. The prior year pre-tax income was due to the gain on the sale of our former battery manufacturing facility in
Switzerland, which was shut down in fiscal 2011. This gain was approximately $13. This gain was offset by additional
restructuring costs of $6.0. These costs, net of the gain on the sale of the former manufacturing facility in fiscal 2012, are
included as a separate line item on the Consolidated Statements of Earnings and Comprehensive Income.
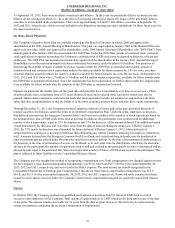
(4) Venezuela
Effective January 1, 2010 and continuing through fiscal 2013, the financial statements for our Venezuela subsidiary are
consolidated under the rules governing the translation of financial information in a highly inflationary economy based on the
use of the blended National Consumer Price Index in Venezuela. Under GAAP, an economy is considered highly inflationary if
the cumulative inflation rate for a three year period meets or exceeds 100 percent. If a subsidiary is considered to be in a highly
inflationary economy, the financial statements of the subsidiary must be re-measured into our reporting currency (U.S. dollar)
and future exchange gains and losses from the re-measurement of monetary assets and liabilities are reflected in current
earnings, rather than exclusively in the equity section of the balance sheet, until such times as the economy is no longer
considered highly inflationary.
On February 13, 2013, the Venezuela government devalued the Bolivar Fuerte relative to the U.S. dollar. The revised official
exchange rate moved from 4.30 per U.S. dollar to an exchange rate of 6.30 per U.S. dollar. The Central Government also
suspended the alternate currency market administered by the central bank known as SITME that made U.S. dollars available at
a rate higher than the previous official rate, generally in the range of 5.50 per U.S. dollar. As access to U.S. dollars at the
official exchange rate was greatly limited, the Company had been utilizing the SITME market to obtain U.S. dollars for the
import of product on a regular basis. As a result, the Company had been using the higher SITME rate, prior to the most recent
devaluation, to translate its operating results and to value its net monetary assets held in local Venezuela currency.
As a result of the devaluation noted above and the elimination of the SITME market, the Company valued its net monetary
assets at September 30, 2013 using the revised official rate of 6.30 per U.S. dollar. Thus, the Company recorded a devaluation
charge of approximately $6 for the twelve months ended September 30, 2013, due primarily to the devaluation of local
currency cash balances. This charge was included in Other financing items, net on the Consolidated Statements of Earnings
and Comprehensive Income. In addition, operating results for the twelve months ended September 30, 2013 were translated
using a blended rate, ranging between 5.40 to 6.30 Bolivar Fuerte per U.S. dollar, reflecting the use of the new official rate for
the period following the devaluation and the previous SITME rate for the period prior to the devaluation.
At September 30, 2013, the U.S. dollar value of monetary assets, net of monetary liabilities, which would be subject to an
earnings impact from translation rate movements for our Venezuela affiliate under highly inflationary accounting was
approximately $62. Further currency devaluation in Venezuela, either through official channels or via the use of alternative
exchange mechanisms may result in additional devaluation of the Company's net monetary assets in Venezuela and may
negatively impact the operating results of the Company's Venezuelan affiliate.
65