Energizer 2013 Annual Report Download - page 51
Download and view the complete annual report
Please find page 51 of the 2013 Energizer annual report below. You can navigate through the pages in the report by either clicking on the pages listed below, or by using the keyword search tool below to find specific information within the annual report.-
 1
1 -
2
-
3
-
4
-
5
-
6
-
7
-
8
-
9
-
10
-
11
-
12
-
13
-
14
-
15
-
16
-
17
-
18
-
19
-
20
-
21
-
22
-
23
-
24
-
25
-
26
-
27
-
28
-
29
-
30
-
31
-
32
-
33
-
34
-
35
-
36
-
37
-
38
-
39
-
40
-
 41
41 -
 42
42 -
 43
43 -
 44
44 -
 45
45 -
 46
46 -
 47
47 -
 48
48 -
 49
49 -
 50
50 -
 51
51 -
 52
52 -
 53
53 -
 54
54 -
 55
55 -
 56
56 -
 57
57 -
 58
58 -
 59
59 -
 60
60 -
 61
61 -
62
-
63
-
64
-
65
-
66
-
67
-
68
-
69
-
70
-
71
-
72
-
73
-
74
-
75
-
76
-
77
-
78
-
79
-
80
-
81
-
82
-
83
-
84
-
85
-
86
-
87
-
88
-
89
-
90
-
91
-
92
-
93
-
94
-
95
-
96
-
97
-
98
-
99
-
100
-
101
-
102
-
103
-
104
-
105
-
106
-
107
-
108
-
109
-
110
-
111
-
112
-
113
-
114
-
115
-
116
-
117
-
118
-
119
-
120
 |
 |

ENERGIZER HOLDINGS, INC.
(Dollars in millions, except per share data)
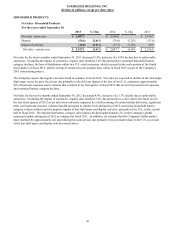
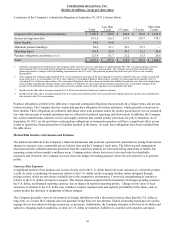
Segment Profit - Household Products
For the years ended September 30,
2013 % Chg 2012 % Chg 2011
Segment profit - prior year $ 400.2 $ 410.6 $ 451.1
Operations 52.1 13.0 % 12.1 3.0 % (66.2)
Impact of currency (11.7) (2.9)% (22.5) (5.5)% 25.7
Segment profit - current year $ 440.6 10.1 % $ 400.2 (2.5)% $ 410.6
Segment profit for fiscal 2013 was $440.6, an increase of $40.4, or 10.1%, inclusive of the negative impact of unfavorable
currencies. Excluding the negative impact of currencies, segment profit increased $52.1, or 13.0%, due primarily to improved
gross margin and reduced overhead spending as a result of savings realized from the Company's 2013 restructuring project.
Segment profit for fiscal 2012 was $400.2, a decrease of $10.4, or 2.5%, as compared to fiscal 2011 due primarily to the
unfavorable impact of currencies. Operationally, segment profit increased $12.1 as reduced gross profit due to continued
household battery volume softness and the market share loss incurred in fiscal 2012 was more than offset by pricing gains, cost
savings related to our 2011 Household Products manufacturing footprint restructuring and global cost containment efforts.
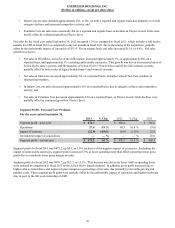
GENERAL CORPORATE AND OTHER EXPENSES
For The Years Ended September 30,
2013 2012 2011
General corporate expenses $ 139.9 $ 151.2 $ 116.9
Integration/other realignment 1.6 0.5 3.0
Sub-Total 141.5 151.7 119.9
2013 restructuring and related costs (1) 150.6 7.3 —
Net pension / post-retirement gains (107.6)——
2011 Household Products restructuring —(6.8) 79.0
ASR costs:
Deal expenses —— 4.2
Severance/other integration 2.5 8.4 9.3
Acquisition inventory valuation —— 7.0
General corporate and other expenses $ 187.0 $ 160.6 $ 219.4
% of net sales 4.2% 3.5% 4.7%
(1) Includes pre-tax costs of $5.2, for the twelve months ended September 30, 2013, associated with certain information technology and related activities,
which are included in Selling, general and administrative expense (SG&A) on the Consolidated Statements of Earnings and Comprehensive Income.
Additionally, includes pre-tax costs of $6.1, for the twelve months ended September 30, 2013, associated with obsolescence charges related to the exit of certain
non-core product lines as part of our restructuring, which are included in cost of products sold on the Consolidated Statements of Earnings and Comprehensive
Income.
General Corporate and Other Expenses
For fiscal 2013, general corporate expenses, including integration/other realignment, were $141.5, a decrease of $10.2 as
compared to fiscal 2012, due primarily to lower compensation-related costs including lower stock award amortization and
lower corporate overhead due, in part, to our restructuring initiatives.
Fiscal 2013 included pre-tax restructuring and related costs of $150.6, which were partially offset by cumulative gains of
$107.6 associated with changes to certain pension and post-retirement benefits.
For fiscal 2012, general corporate expenses, including integration/other realignment, were $151.7, an increase of $31.8 as
compared to fiscal 2011, due primarily to higher corporate expenses including:
• increased costs of approximately $13 due to the year over year change in the underlying value of the Company's
unfunded deferred compensation liabilities driven by the increase in the value of market securities,
41