EasyJet 2009 Annual Report Download - page 94
Download and view the complete annual report
Please find page 94 of the 2009 EasyJet annual report below. You can navigate through the pages in the report by either clicking on the pages listed below, or by using the keyword search tool below to find specific information within the annual report.-
 1
1 -
2
-
3
-
4
-
5
-
6
-
7
-
8
-
9
-
10
-
11
-
12
-
13
-
14
-
15
-
16
-
17
-
18
-
19
-
20
-
21
-
22
-
23
-
24
-
25
-
26
-
27
-
28
-
29
-
30
-
31
-
32
-
33
-
34
-
35
-
36
-
37
-
38
-
39
-
40
-
41
-
42
-
43
-
44
-
45
-
46
-
47
-
48
-
49
-
50
-
51
-
52
-
53
-
54
-
55
-
56
-
57
-
58
-
59
-
60
-
61
-
62
-
63
-
64
-
65
-
66
-
67
-
68
-
69
-
70
-
71
-
72
-
73
-
74
-
75
-
76
-
77
-
78
-
79
-
80
-
81
-
82
-
83
-
 84
84 -
 85
85 -
 86
86 -
 87
87 -
 88
88 -
 89
89 -
 90
90 -
 91
91 -
 92
92 -
 93
93 -
 94
94 -
 95
95 -
 96
96
 |
 |

92 easyJet plc Annual report and accounts 2009
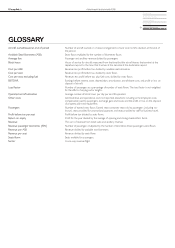
GLOSSARY
Aircraft owned/leased at end of period Number of aircraft owned or on lease arrangements of over one month’s duration at the end of
the period.
Available Seat Kilometres (ASK) Seats flown multiplied by the number of kilometres flown.
Average fare Passenger and ancillary revenue divided by passengers.
Block hours Hours of service for aircraft, measured from the time that the aircraft leaves the terminal at the
departure airport to the time that it arrives at the terminal at the destination airport.
Cost per ASK Revenue less profit before tax, divided by available seat kilometres.
Cost per seat Revenue less profit before tax, divided by seats flown.
Cost per seat, excluding fuel Revenue, less profit before tax, plus fuel costs, divided by seats flown.
EBITDAR Earnings before interest, taxes, depreciation, amortisation, aircraft lease costs, and profit or loss on
disposal of aircraft.
Load factor Number of passengers as a percentage of number of seats flown. The load factor is not weighted
for the effect of varying sector lengths.
Operated aircraft utilisation Average number of block hours per day per aircraft operated.
Other costs Administrative and operational costs not reported elsewhere, including some employee costs,
compensation paid to passengers, exchange gains and losses and the profit or loss on the disposal
of property plant and equipment.
Passengers Number of earned seats flown. Earned seats comprises seats sold to passengers (including no-
shows), seats provided for promotional purposes and seats provided to staff for business travel.
Profit before tax per seat Profit before tax divided by seats flown.
Return on equity Profit for the year divided by the average of opening and closing shareholders’ funds.
Revenue The sum of revenue from ticket sales and ancillary revenue.
Revenue passenger kilometres (RPK) Number of passengers multiplied by the number of kilometres those passengers were flown.
Revenue per ASK Revenue divided by available seat kilometres.
Revenue per seat Revenue divided by seats flown.
Seats flown Seats available for passengers.
Sector A one-way revenue flight.